This section describes cases studies profiling the asset valuation approaches of two highway agencies from Britain and Australia. Each case study demonstrates how the agency defines its asset hierarchy, establishes replacement costs, and calculates depreciation. The agencies profiled in the case studies follow the asset valuation guidance established in their respective countries, and their work in this area predates the development of this document. Nonetheless, both agencies use approaches that are very consistent with the guidance presented here, illustrating the common philosophy between the guidance, international standards for calculating asset value, and the state of the practice worldwide.
Highways England is a public company responsible for managing the Strategic Road Network (SRN) in England, which is a core set of 4,300 miles of major roads that represents a third of all road traffic and two thirds of freight traffic. The organization is wholly owned by the British government and receives all of its capital and revenue funding directly from the United Kingdom (UK) Department for Transport (DfT). Nonetheless, Highways England operates as a company, and produces company financial accounts to provide visibility of its ongoing stewardship and value in terms of taxpayer equity. Asset value is computed and reported as part of the organization’s financial health.
The following paragraphs describe the approach used by Highways England to value its portion of the total British SRN. Note that Highway England’s approach is also used by the other SRN operating organizations: Transport Scotland for the SRN in Scotland; the Welsh Government for the SRN in Wales; and the Northern Ireland Department for Infrastructure for the SRN and all local roads in Northern Ireland. Additionally, the Northern Ireland Department for Infrastructure uses the same methodology for river and coastal assets in Northern Ireland.
Highways England’s approach to asset valuation is undertaken in accordance with Government Financial Reporting Manual (FReM) (49). For infrastructure assets, the manual uses the principles of Royal Institution of Chartered Surveyors (RICS) as described in the RICS “Red Book” (50). The company determines the fair value of the SRN using Depreciated Replacement Cost (DRC) in accordance with the guidance provided by the FReM and the Red Book. This approach is consistent with accounting standard IFRS 13 for calculating fair value (3). It results in the calculation of the value of the SRN from the perspective of a theoretical buyer based on how much it would cost to construct a network of equivalent service potential.
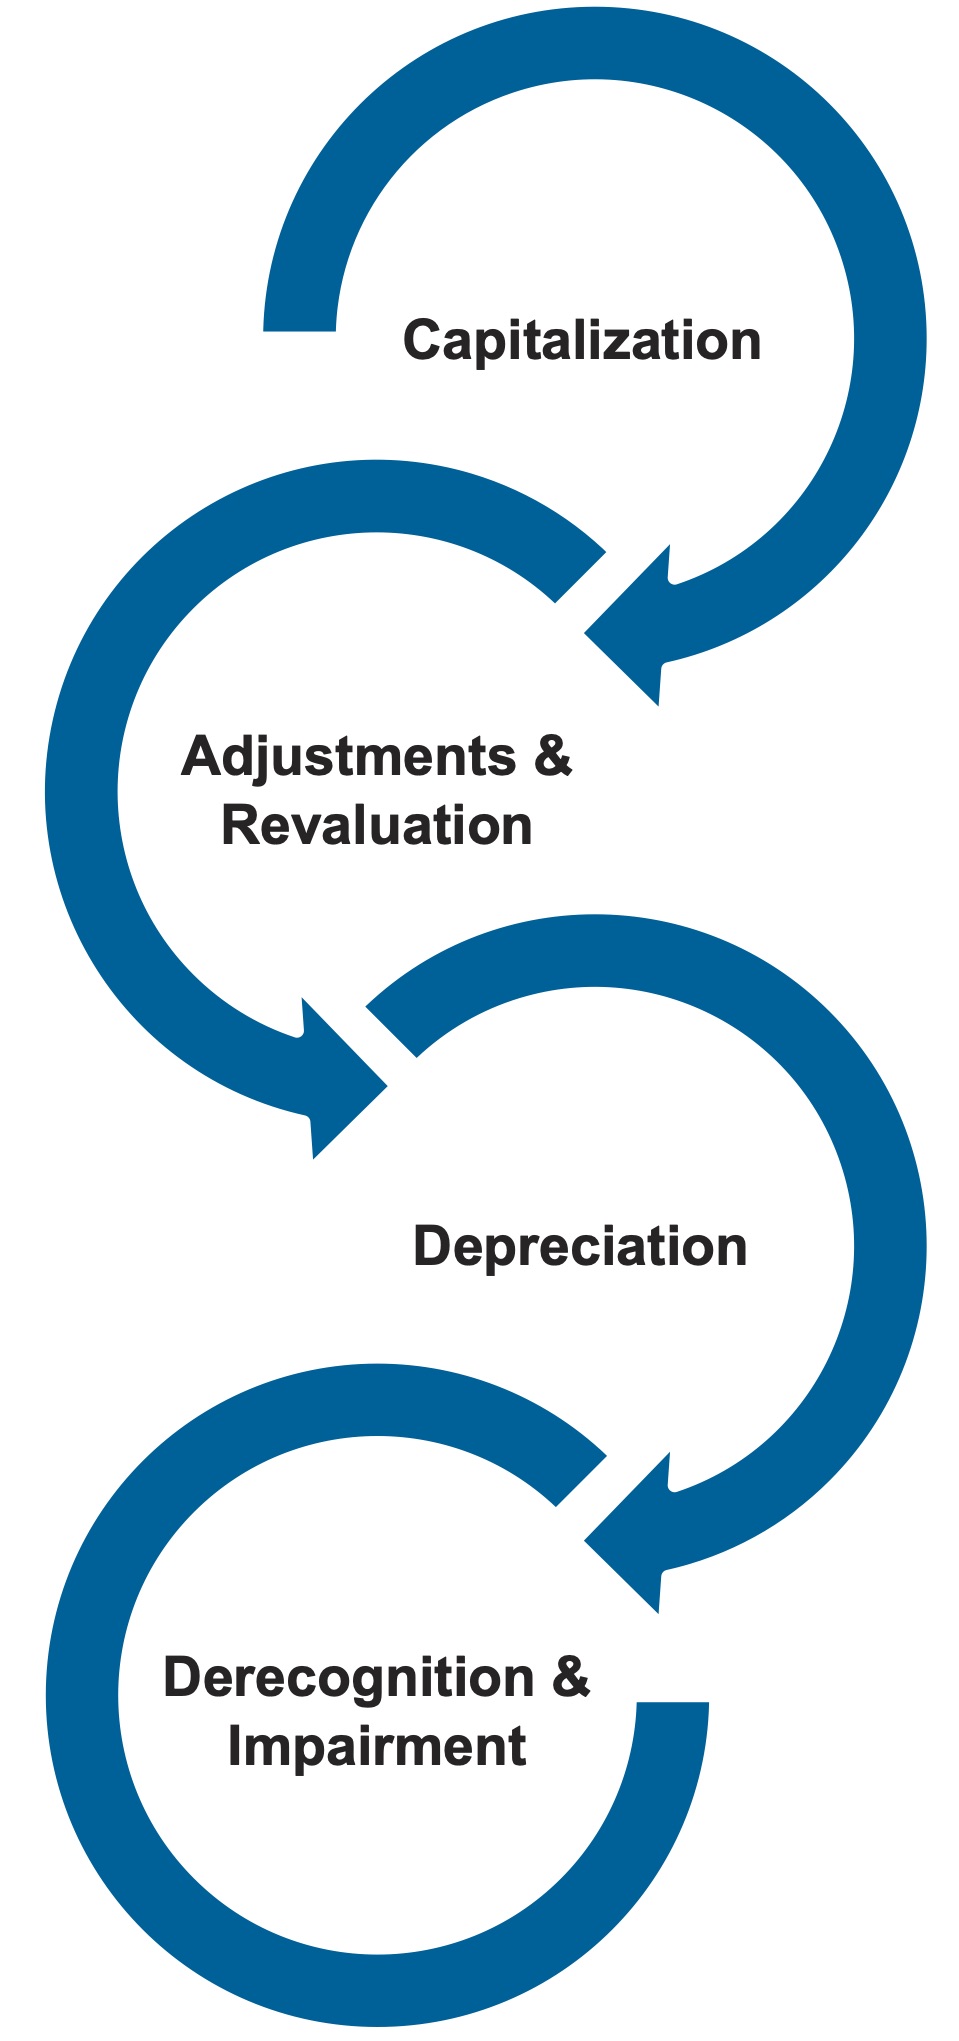
Figure 9-7 summarizes the process used by Highways England for calculating value. First, the organization calculates capital expenses. These costs are adjusted to obtain the ‘as new’ replacement cost based on a modern equivalent asset offering the same function (which the company establishes as identical routing and capacity) on a greenfield site.
Replacement costs are calculated for four asset classes:
- Pavements;
- Structures;
- Technology Assets; and
- Land
Note that the valuation for pavement is assumed to include the value of a number of other ancillary assets, such as vehicle restraint systems, signage, drainage, and other traffic and safety assets. For each asset class Highways England first calculates unit rates, and then applies the unit rate to the asset quantity to calculate replacement cost.
Following the calculation of replacement cost, the organization then calculates depreciation. Depreciation and other adjustments account for impaired or obsolete (derecognized) assets and are applied to the replacement cost to obtain DRC. Depreciation of asset value is calculated based upon asset condition surveys. While renewals are performed that improve conditions, these are not treated for accounting purposes as having an impact upon the valuation of the network because any related improvement in road condition are reflected in the condition surveys. Thus, Highways England depreciate 100% of renewals expenditures in the year that they are incurred.

Depreciation is based on the observed condition of assets. For pavement, condition is measured based on rutting. For structures, an Element Condition Score is obtained from structure inspections performed for each element of a structure. Land assets are not depreciated.
To ensure a robust valuation, Highways England undertakes a full valuation of each asset category at intervals not exceeding five years. A revaluation of pavements and lands was undertaken in the period of 2019 to 2020. At the time of that valuation, the value of the SRN was estimated to be approximately £123.2 billion. Updated valuations of structures and technology are planned in 2023 and 2024, respectively.
Highways England makes improvements to its valuation approach on a continuing basis. For example, historically depreciation for pavement is calculated based on rutting. In the future, Highways England plans to improve this depreciation calculation by including other pavement distresses, such as fretting, texture, and longitudinal cracking. Also, the organization plans to perform a separate calculation for special structures, unique to the network, that are best valued on a case-by-case basis rather than using unit rates.
This case study describes the asset valuation approach used by a major government road authority in Australia. The authority is responsible for managing a large network of public roads, privately-funded toll roads, bridges, culverts, tunnels, and other assets. Valuations are conducted according to local government and national (Australian) accounting policies and standards. These standards emphasize basing estimates on fair value, consistent with international accounting standards.
The agency uses what it calls “Optimized Depreciated Replacement Cost (ODRC)” to value its assets. This term highlights that the replacement cost used is the cost to replace an asset with its modern equivalent, rather than the cost of a replacing an asset in-kind.
Figure 9-8 summarizes the process used by the authority to calculate fair value for its assets. As shown in the figure, the process includes steps for calculating replacement cost, and then adjusting replacement cost based on deprecation. Note the authority’s process includes some additional steps not shown in the figure which further modify fair value to reflect planned work.

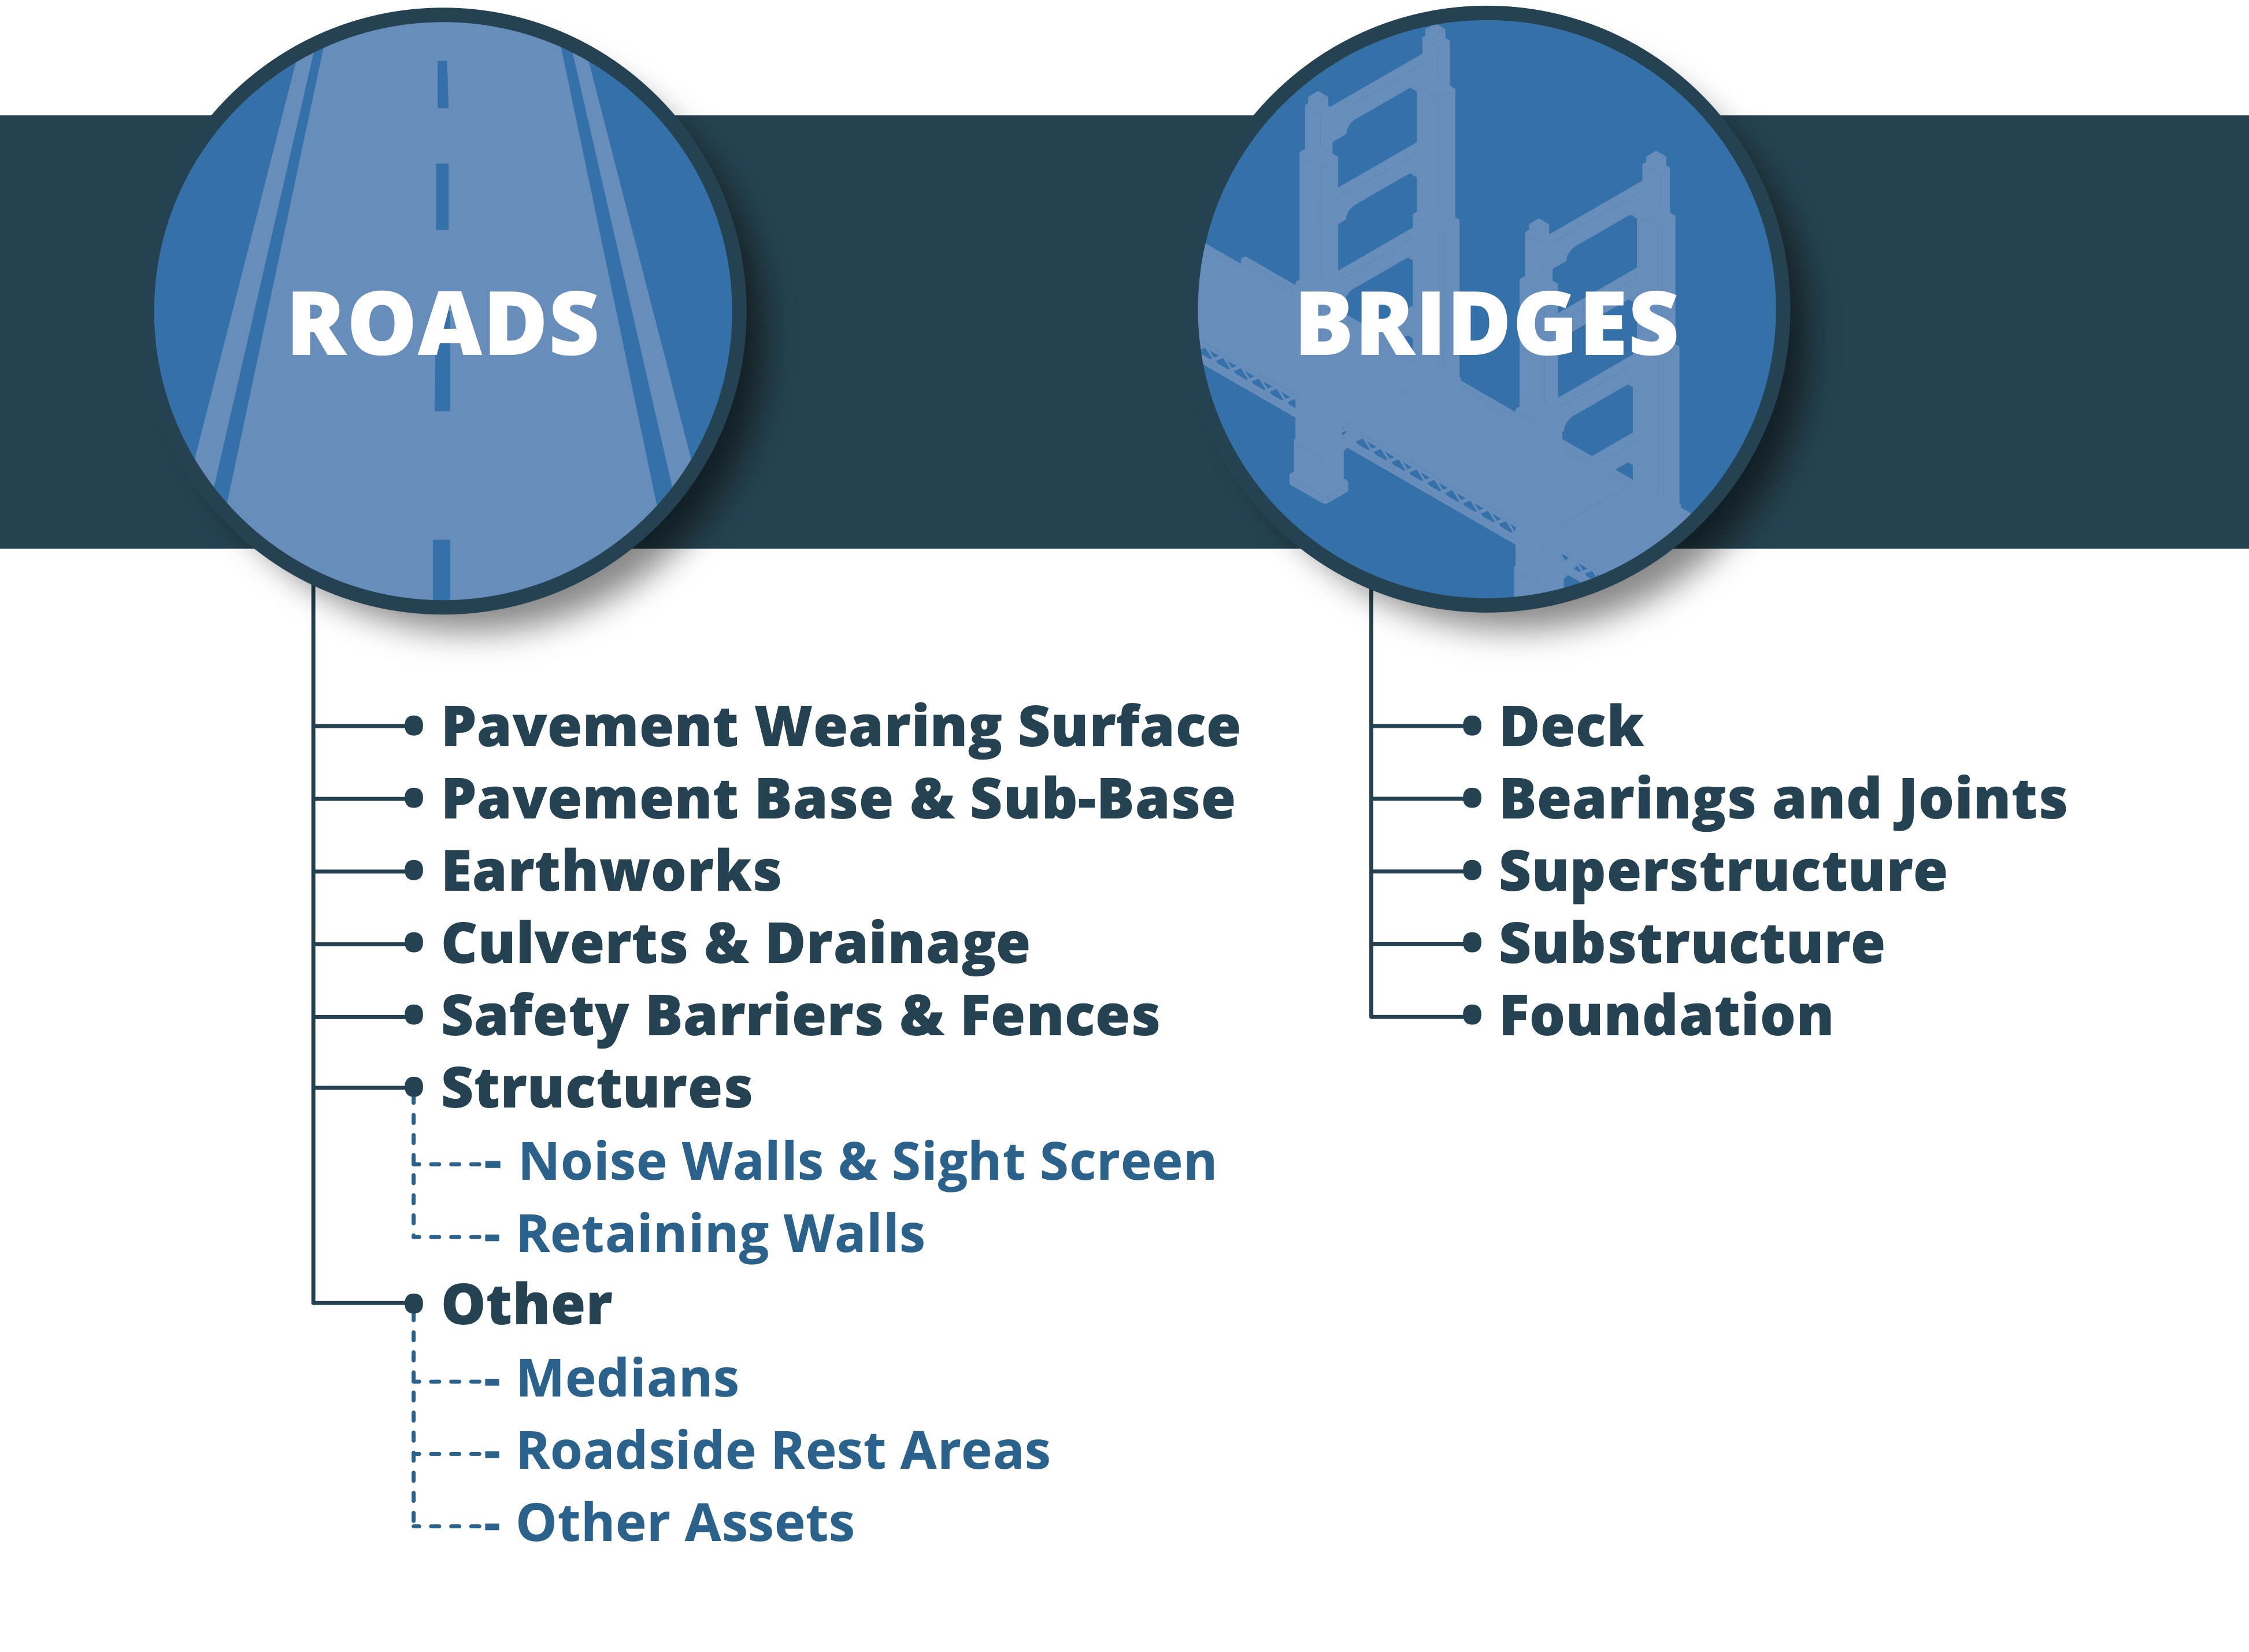
The approach is applied to calculate value for four asset classes: roads; minor roads; bridges; and tunnels. Assets are valued at the component-level where sufficient data are available to support the calculation. Figure 9-9 shows how roads and bridges are subdivided into components.

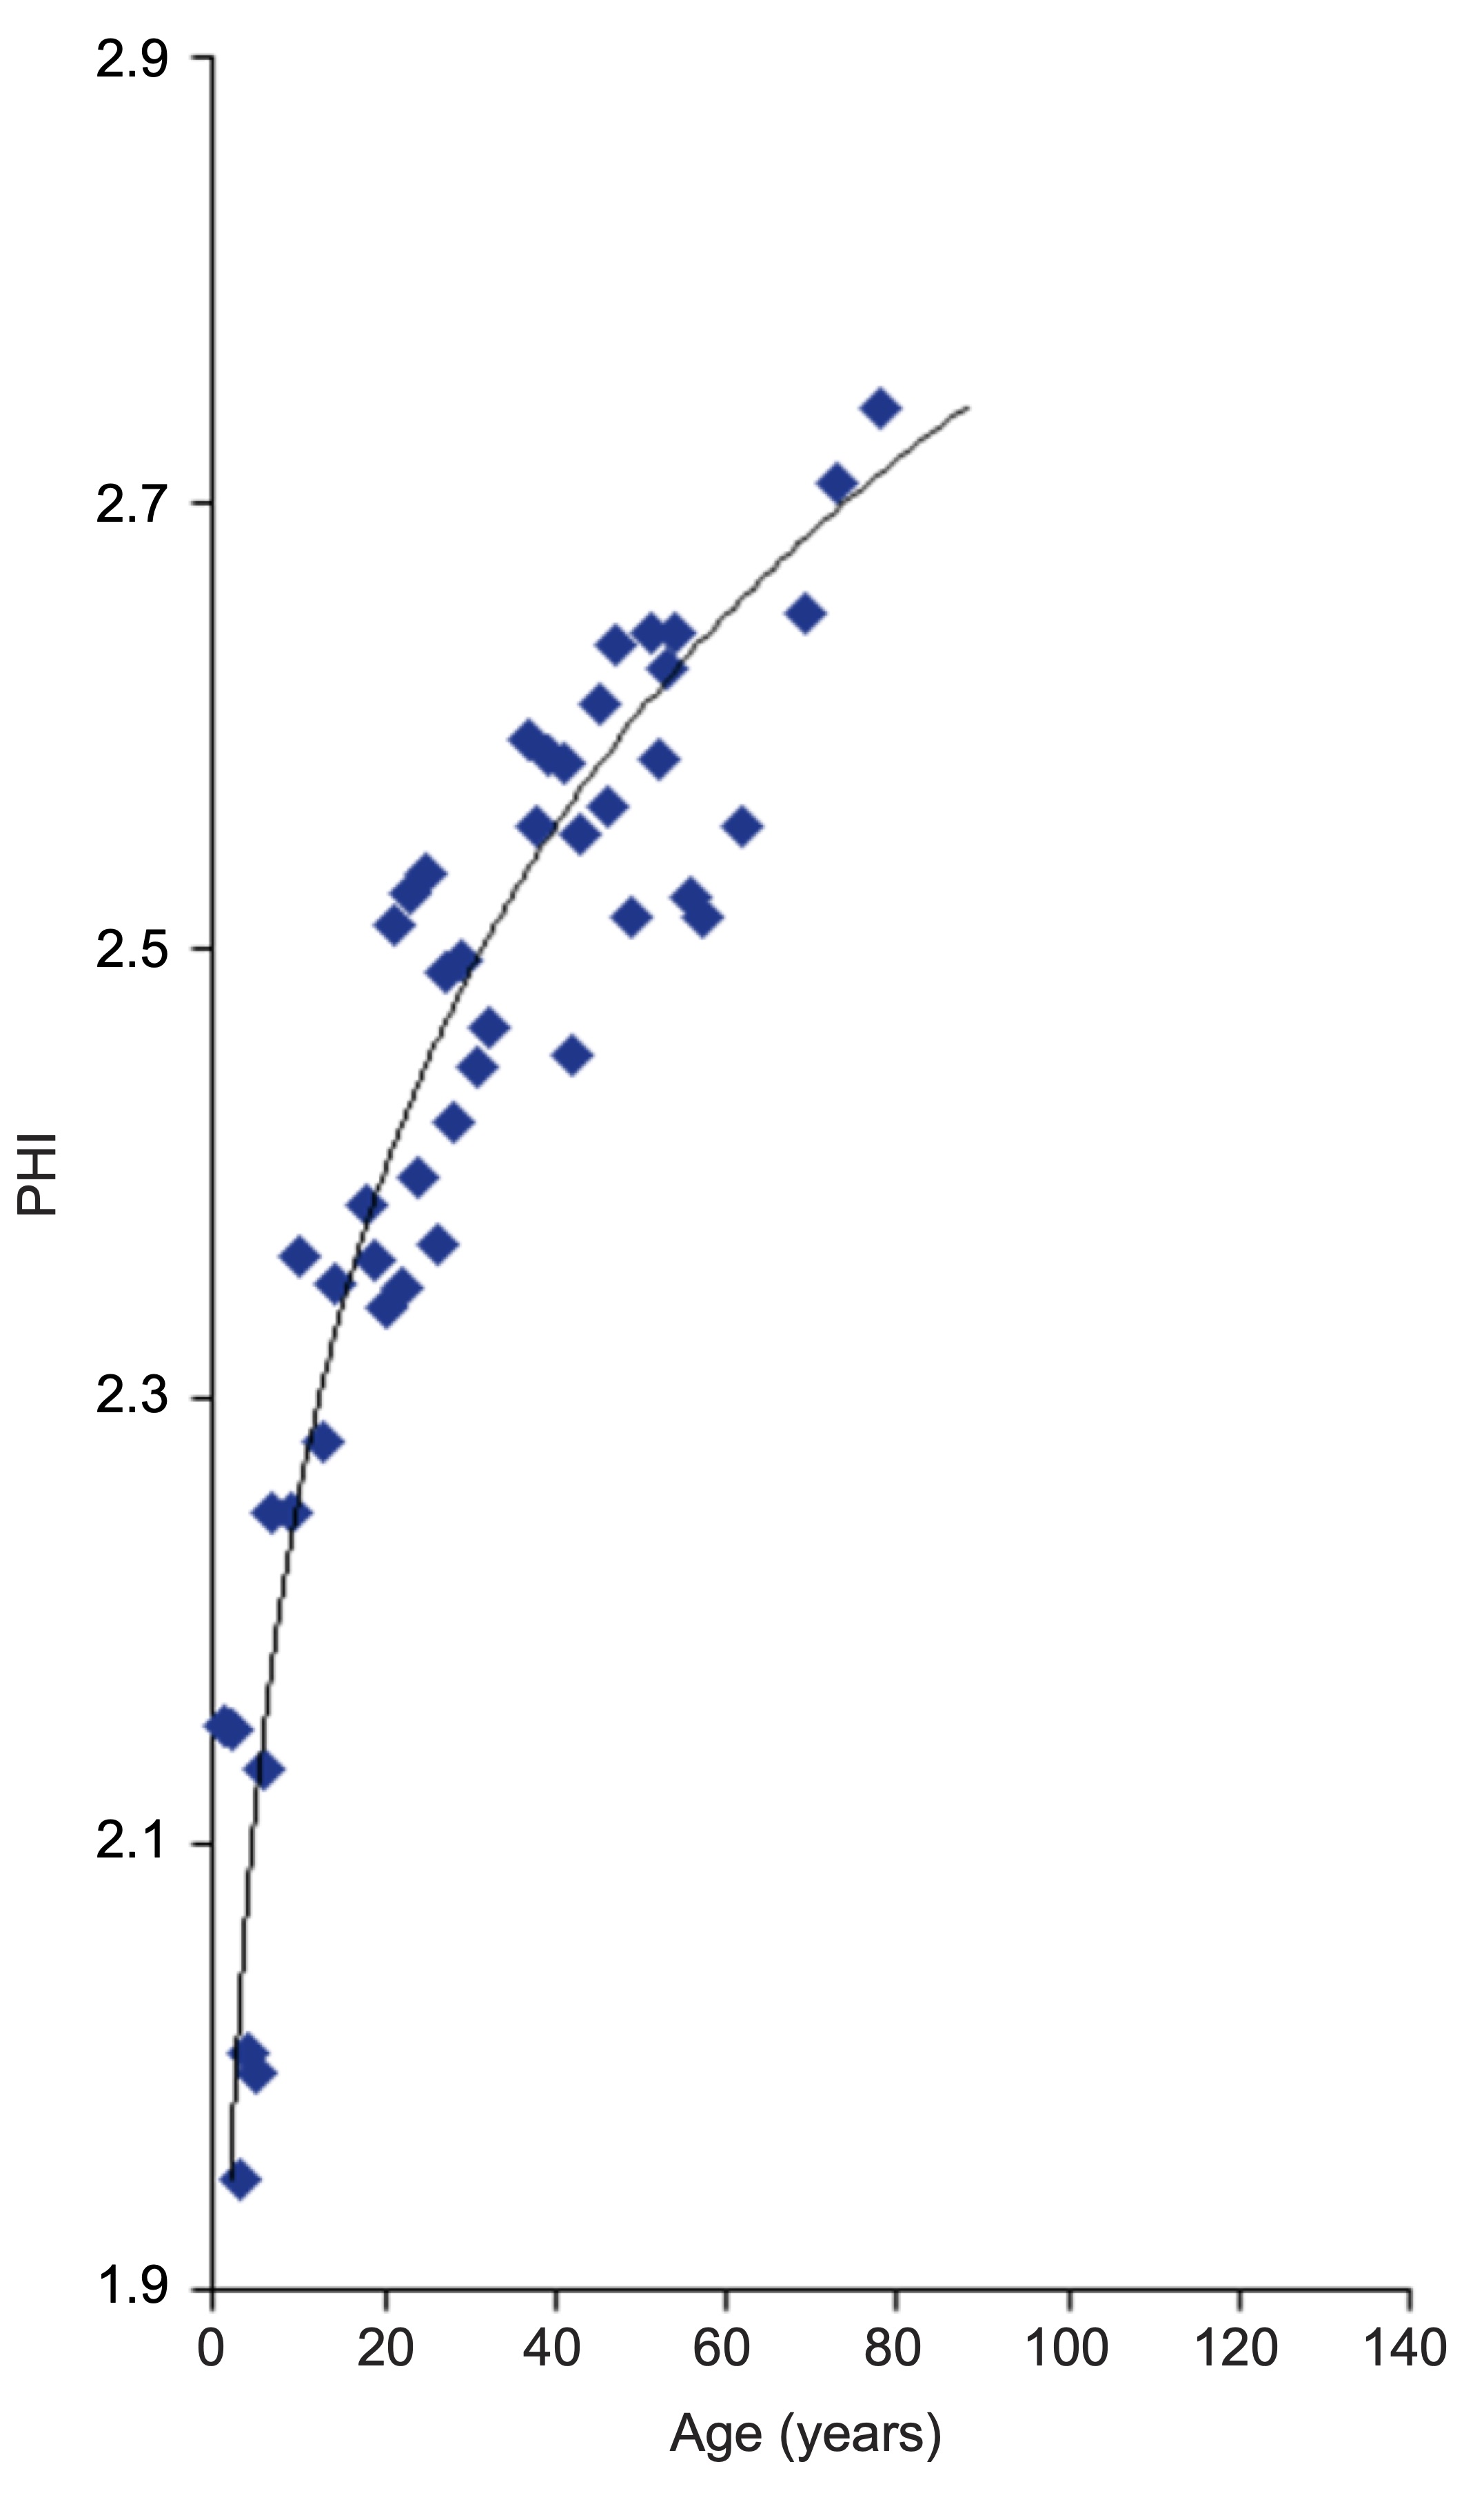
Depreciation is calculated based on condition data where data are available to support the calculation. For example, the authority calculates a measure of pavement condition called Pavement Health Index (PHI) which is based on data for rutting, cracking, and other pavement distresses. Separately the authority performs an analysis to relate PHI to effective age. This relationship is applied to estimate the effective age of each segment, which is subsequently used to calculate depreciation for the pavement wearing surface. Figure 9-10 shows the relationship between PHI and effective age for flexible pavement.
Note that where detailed data are unavailable for a given asset component, the value of the component is estimated as a percentage of the value of the asset. Also, earthwork assets are not depreciated.
The end result of the calculation is an asset value that is comprehensive, leverages detailed data on individual components, and reflects best engineering judgement on asset condition and remaining life.
