After establishing the motivation for calculating asset value and reviewing available data, the next step is to identify which assets will be included in the valuation calculation through establishing an asset hierarchy. An asset hierarchy is a framework for organizing a set of assets. It specifies asset classes and sub-classes, as well as any parent-child relationships between different types of assets.
Note that an organization may already have established an asset hierarchy that can be used to support this step. Alternatively, one may establish a hierarchy specifically for the purpose of calculating asset value. In any case, it is important to note that the set of assets included in the asset value calculation may be different from that defined for other purposes. Thus, if one is referencing an existing hierarchy, it will be necessary to further note which assets are included explicitly in the asset value calculation, which are included implicitly as part of some other asset, and which are excluded.
Assets exist within a network, and they rely upon the collective maintenance of the network to function properly. If some assets in these networks are not explicitly valued, their impact should be accounted for implicitly within the valuation. Also, at this point practitioners should establish whether the asset value calculation is focused on specific systems or subsets of assets. Asset subsets comprise its inclusion within a system (e.g., on the NHS or Interstate), ownership of the asset (federal, state, or local), and the asset’s geography.
A final consideration for the asset hierarchy is ensuring that assets excluded from the analysis are not neglected in maintenance or other investments. By analyzing assets within a network or along a corridor, one can weigh all aspects of maintenance for all levels of assets, from geotechnical structures to the pavement markings.
The following subsections describes common classes of transportation assets and considerations in calculating asset value for each.
Minnesota DOT (MnDOT) includes calculates value for pavement and bridge assets in its 2019 TAMP, as well as for culverts, tunnels, signs, light towers, noise walls, signals & lighting, pedestrian infrastructure, buildings and ITS. The table displays MnDOT’s full asset hierarchy.

Source: Minnesota DOT (29)

This asset includes the wearing surface of roads, runways, sidewalks and other paved surfaces, as well as the other layers supporting the wearing surface. For highway agencies pavement is typically the asset with the greatest overall value; it is the asset a highway department has the most of. State DOTs are required to estimate the value of their NHS pavement in their TAMPs.
State DOTs are required to maintain an inventory of their roadway pavement through the Highway Performance Monitoring System (HPMS), and to collect condition data for different pavement distresses for pavement on the NHS. A challenge in managing pavement data is that pavement is a linear asset, and can be sectioned in different ways. For instance, condition data may be collected and reported for 1/10-mile sections, while longer management sections are used for predicting future conditions and developing projects.
Frequently, asset value calculations include a number of additional assets as part of the valuation of pavement, to the extent these additional assets may be replaced or reconstructed as part of a project to replace or rehabilitate the pavement. This may include shoulders, curbs, pavement markers/markings, signs, and drainage assets. Also, sidewalks and bike paths, though paved, are often treated as separate assets from roadway pavement.
Pavement life varies by material type (e.g., asphalt, concrete, hybrid, etc.), operating environment, how the pavement is maintained, how the end-of-life is defined, and what specific assets are included as part of the pavement asset. Typically, the wearing surface of a road is assumed to last approximately 20 years, while the “full-depth life” which includes multiple rehabilitation treatments of the wearing surface, is assumed to be approximately 50 years (18).
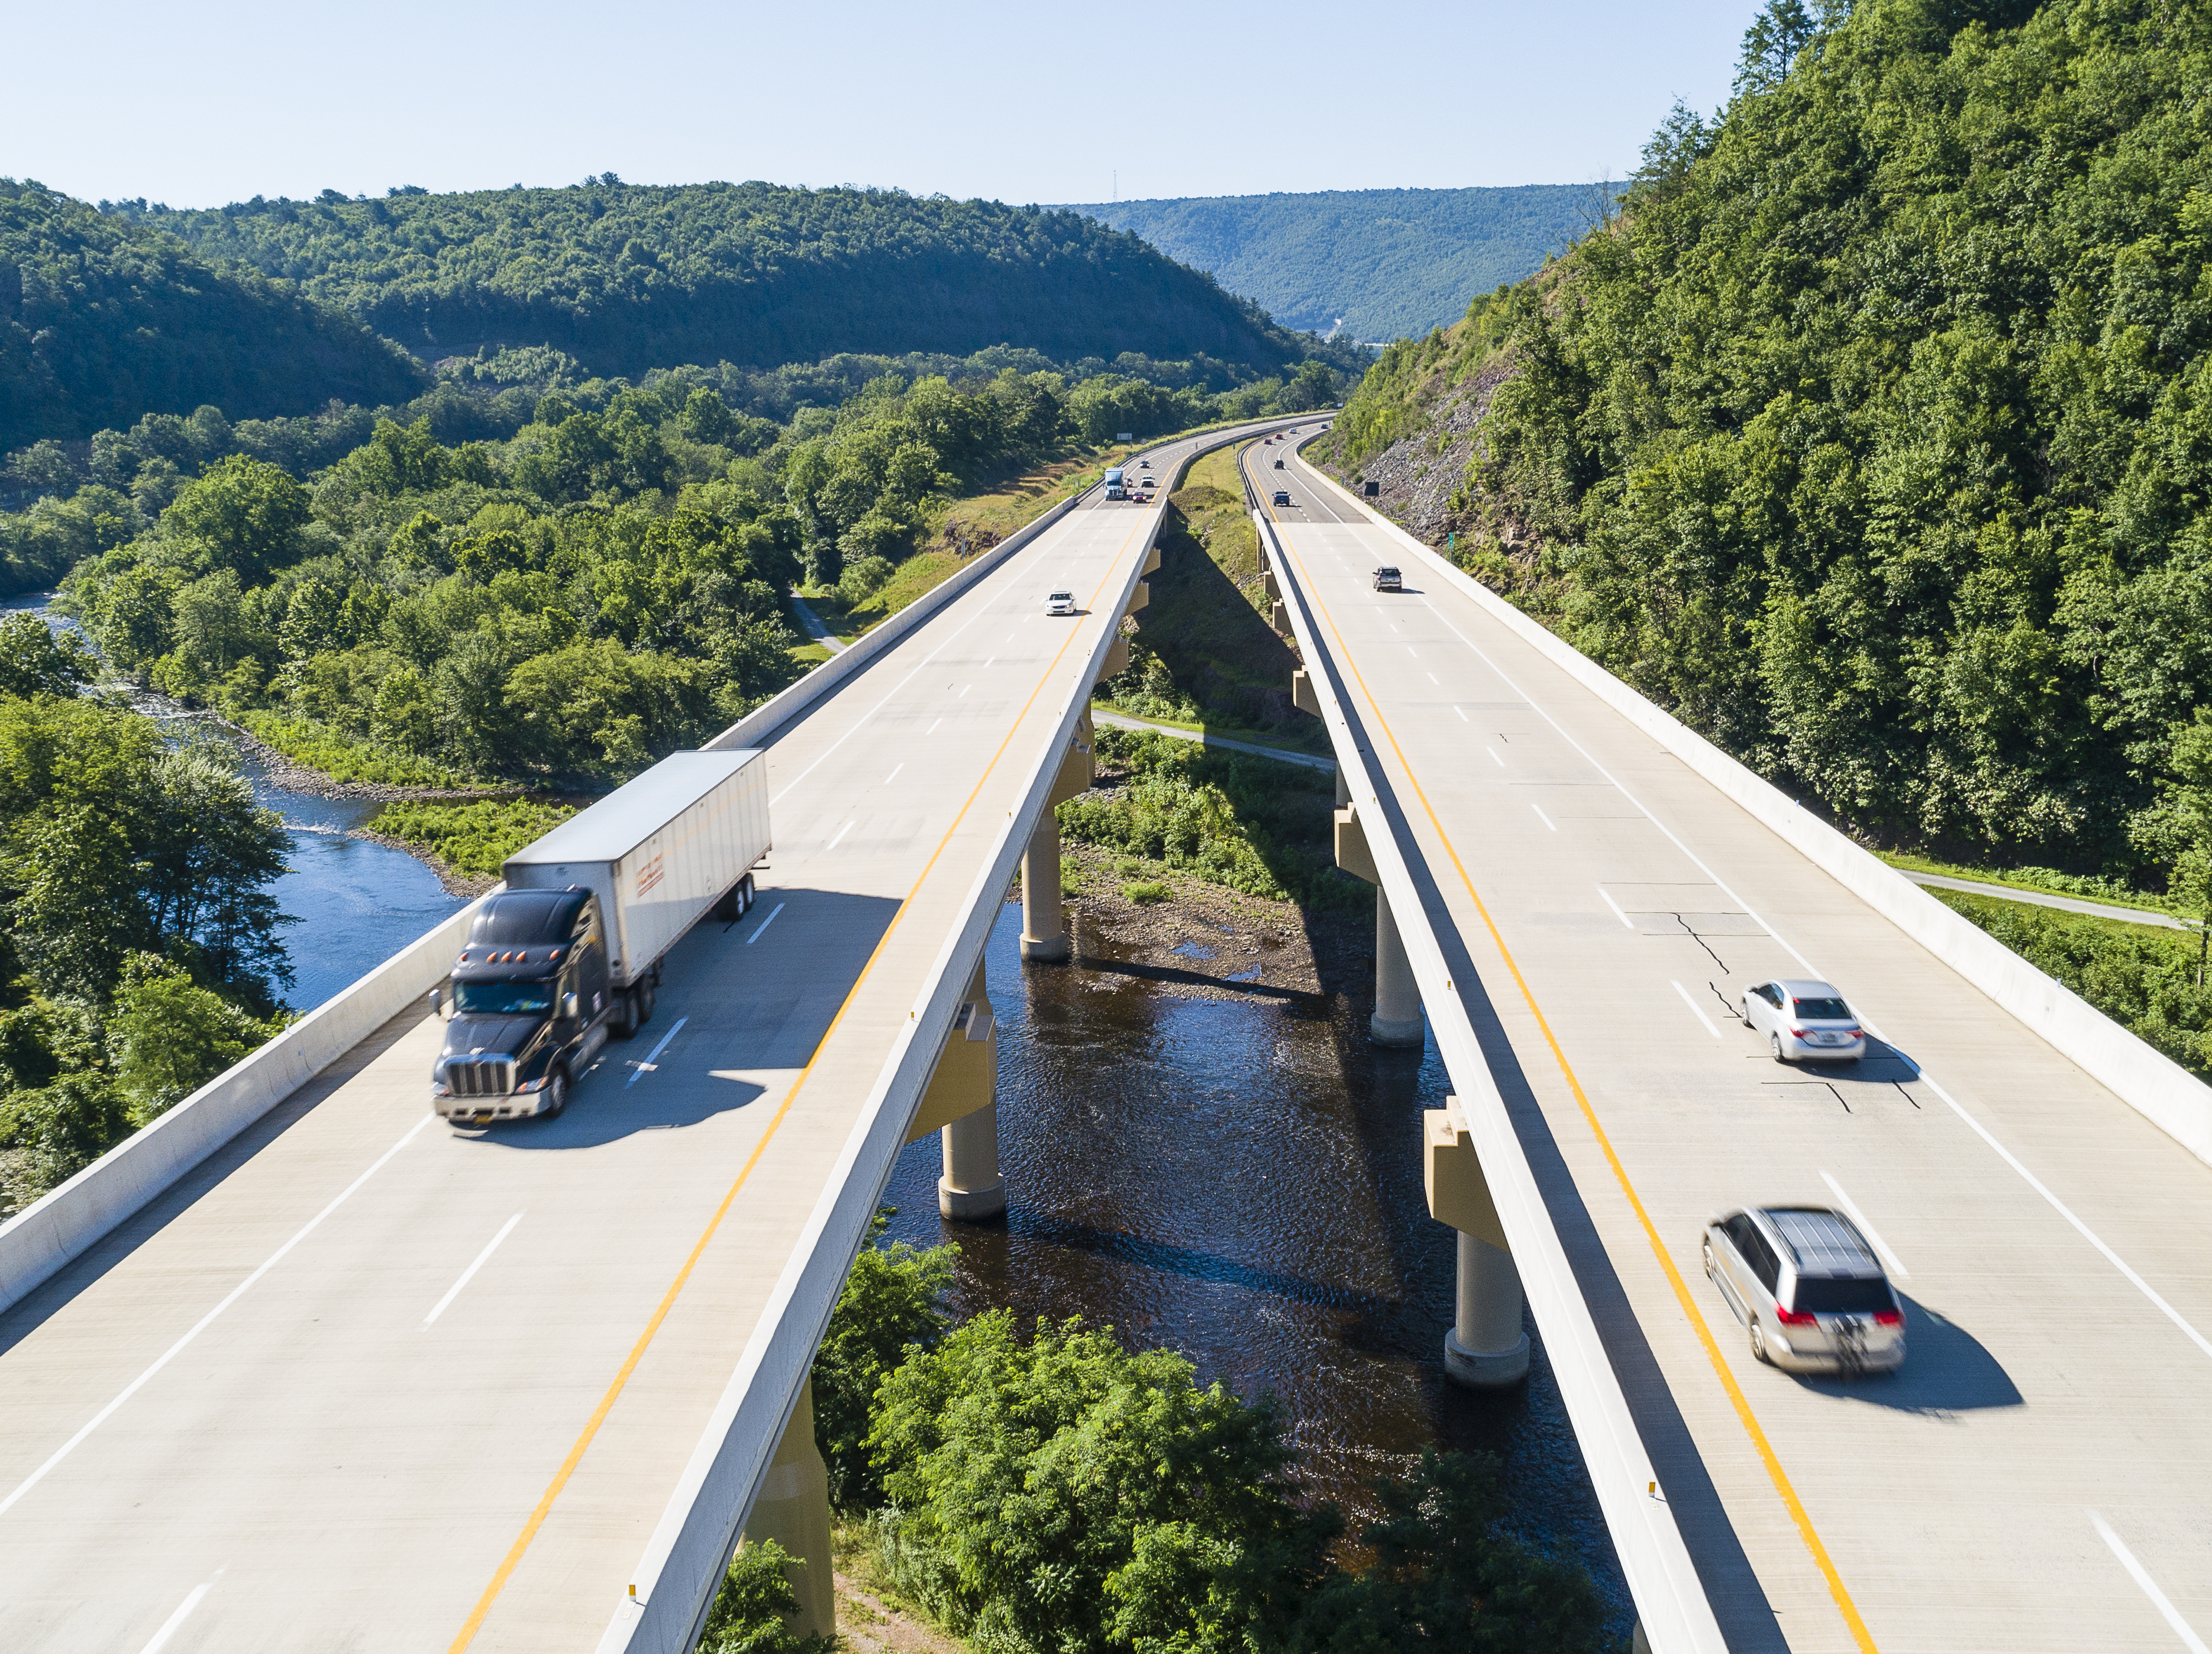
This asset class includes constructed works that allow a road to span a physical obstacle, such as a river or other road. For a highway agency structures are typically the asset class with the second greatest value following pavements.
Here this asset class is defined to include bridges and tunnels, and culverts. In practice the terms “structures” and “bridges” are often used interchangeably. In the U.S. bridges, tunnels and larger culverts are all included in the National Bridge Inventory (NBI) and State DOTs are required to estimate the value of their NHS structures in their TAMPs.
State DOTs are required to maintain an inventory of all bridges on public roads in their state. Also, State DOTs are to report condition data for the bridges in the state, collected through periodic visual inspections.
Structures are long-lived assets. As a practical matter, a structure can remain functional for 100 years or more if it is appropriately maintained. However, structures are often replaced when replacement is the most cost-effective alternative for addressing deterioration, or if the structure has functional issues that render it obsolete (e.g., designed for smaller loads or traffic levels than current standards). Based on review of the 2019 State DOT TAMPs, DOTs typically assume a design life of 75 years for their structures for the purpose of calculating asset value.

This class includes a number of different assets that either enhance mobility and/or improve safety. This includes, but is not limited to:
- Signs and their supporting structures
- Traffic signals
- Lighting
- Guardrail, median barriers, cable barriers and other impact attenuators
- Pavement markings and markers
- Intelligent Transportation Systems (ITS) devices such as cameras, other sensors and detectors, and variable message signs
- Tolling systems
- Grade crossings
Practices regarding management of traffic and safety assets vary widely between specific asset types and agencies. NCHRP Synthesis 371 provides a summary of current practices and typical asset lives for several common types of assets (19). Service lives for traffic and safety assets range from one to two years for certain types of pavement markings to 20 years or more for guardrails and median barriers.
Generally, agencies lack data on asset condition for many traffic and safety assets, as collecting condition data can be impractical and condition is often a poor predictor of when the asset needs to be replaced. Furthermore, many agencies have limited or incomplete inventory data on these assets, which is the starting block for collecting condition data. In many cases, traffic and safety assets are replaced due to functional obsolescence rather than as a result of their physical deterioration. As noted above, these assets are frequently replaced as part of a larger effort to rehabilitate a section of pavement or a corridor, and thus, they are often valued as part of the pavement asset class.
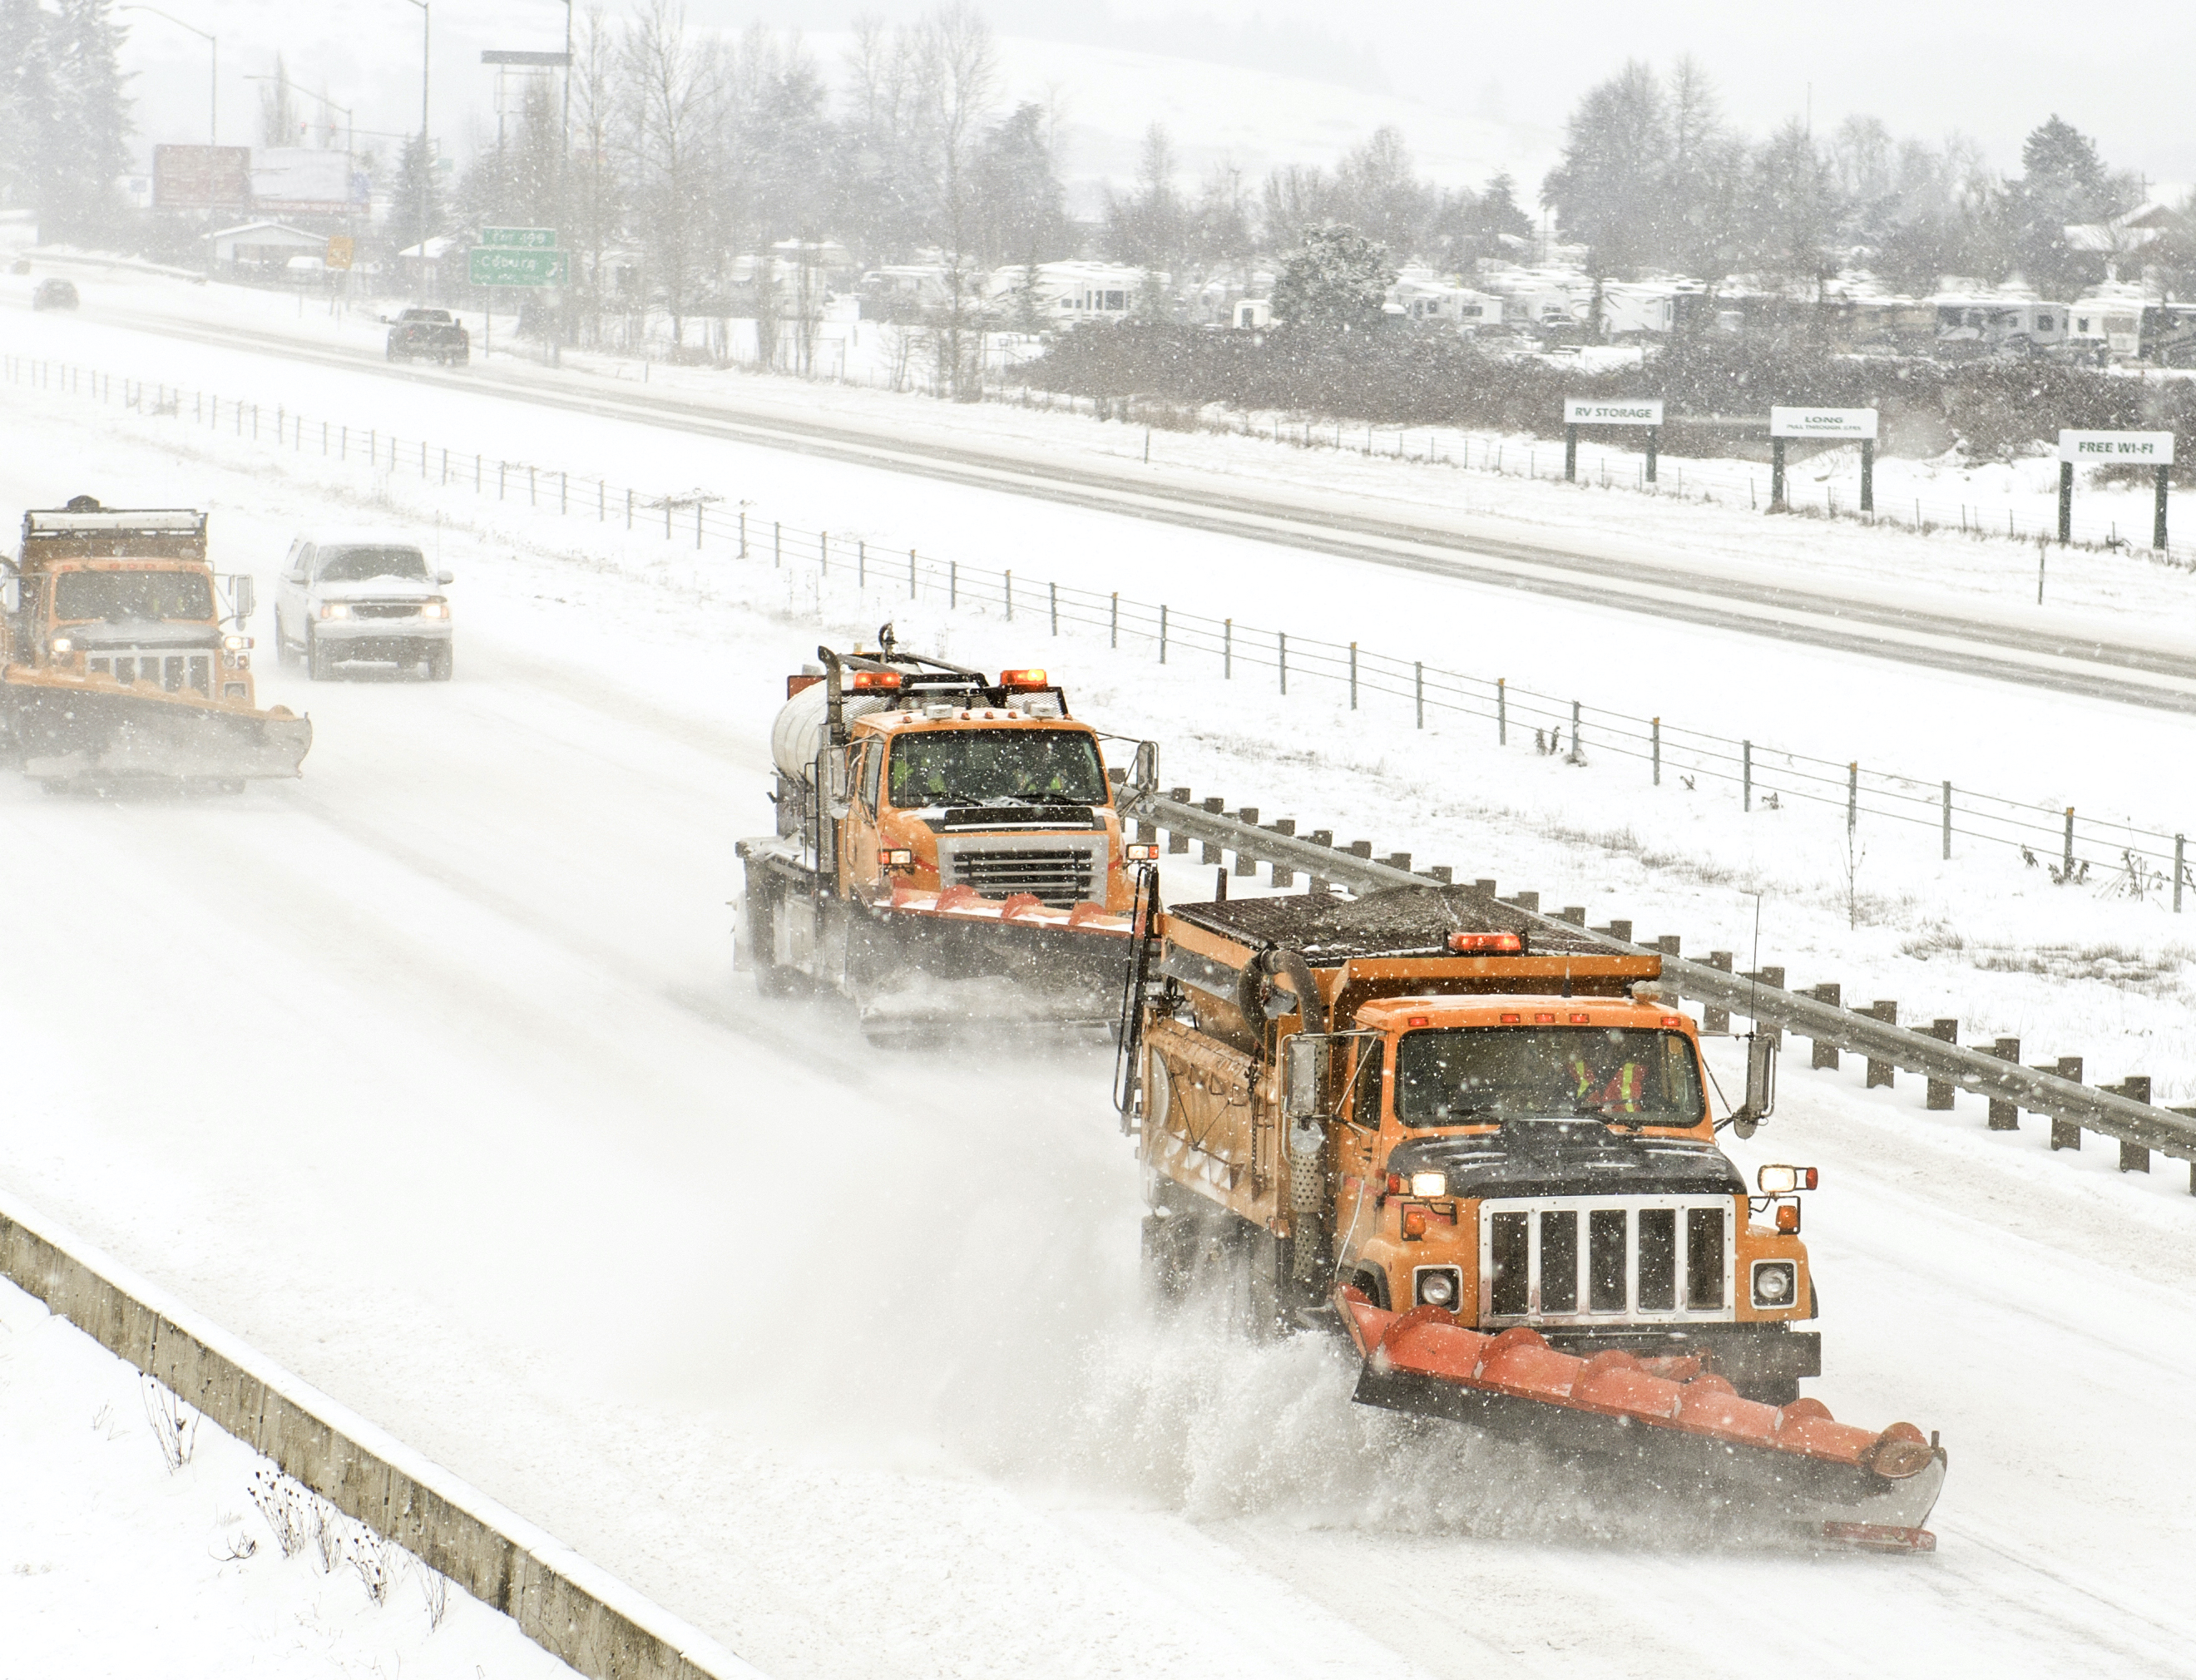
Vehicle assets include revenue and maintenance vehicles, such as buses, paratransit vehicles, ferries, train cars, tow trucks, plows, and various other types of service vehicles. For State DOTs vehicles are often a small portion of an agency’s inventory. On the other hand, for transit agencies revenue vehicles typically represent the largest single asset class an agency owns based on asset value.
The Federal Transit Administration (FTA) has published assumed useful lives, termed “useful life benchmarks,” for a range of vehicle types (20). Default values are 8 years for four-tired vehicles such as automobiles and vans, 14 years for buses, 31 years for light and heavy rail vehicles, and 39 years for commuter rail coaches and locomotives.
Agencies track inventory data on their vehicles, but approaches vary regarding tracking condition data. Often age or vehicle mileage is used as a proxy for asset condition. Transit agencies report data by vehicle subfleet for revenue and service vehicles to the National Transit Database (NTD).
A notable feature of vehicles is that relative to fixed assets they are more easily transferred from one owner to another. Thus, it is often feasible to establish a market value for vehicles using information on the sale or auction of used vehicles.
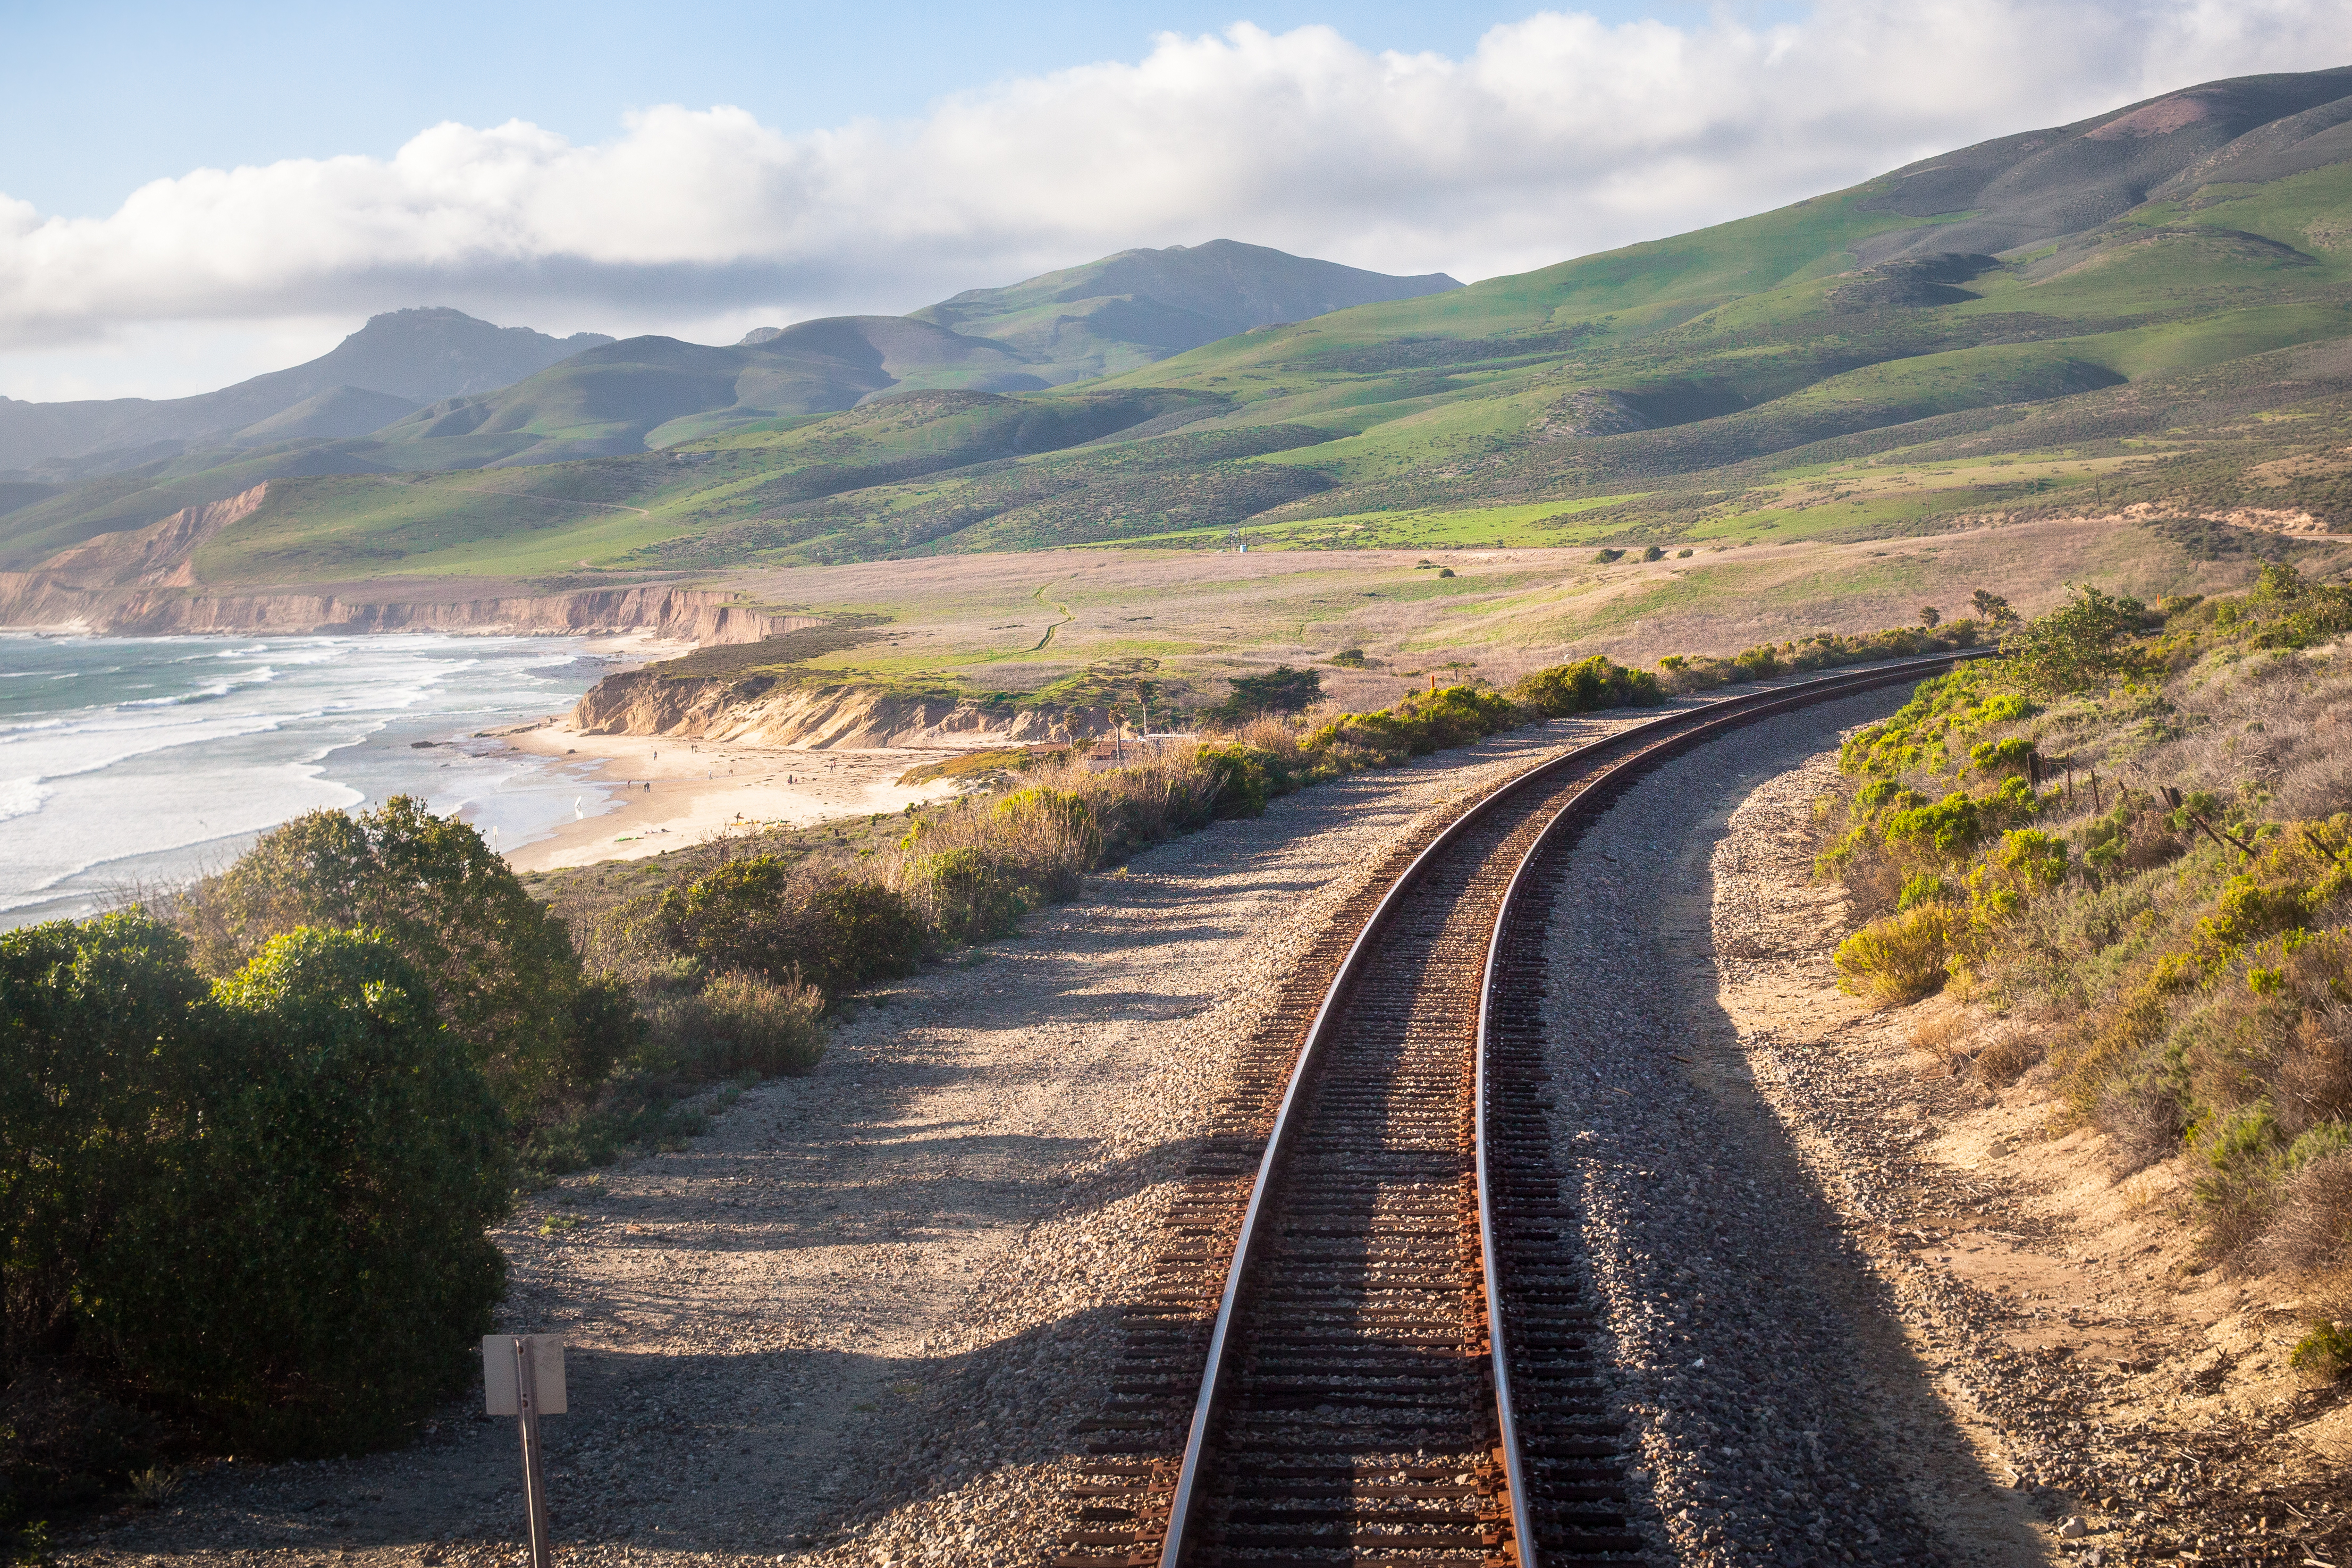
For transit systems that operate light rail, heavy rail or commuter rail, fixed guideway is a significant asset class. This includes track, communications and signals, and electrification systems. For the purpose of reporting to the NTD, transit agencies group other fixed assets besides facilities into the category of “Infrastructure.” In the NTD this category also includes structures and guideway for bus rapid transit systems that are addressed above in structures and pavement.
It is difficult to generalize management approaches and asset lives as these vary significantly between different asset subclasses and agencies. Generally fixed guideway assets tend to be long-lived. Track requires periodic rehabilitation but can be maintained indefinitely. Communications, signals, and electrification assets have varying lives which are often dictated by consideration of functional obsolescence rather than physical condition. Transit agencies report data on their inventory and its age to the NTD. FTA describes different guideway assets and management approaches in its Transit Asset Management Guide (21).
Transportation agencies own and operate a number of facilities. Typical facilities for highway agencies are discussed in (22) and include:
- Administrative facilities
- Maintenance depots;
- Rest areas;
- Toll plazas;
- Weight stations; and
- Communications facilities.
Transit facilities are classified in the NTD as either: administrative/maintenance facilities such as office buildings, bus garages or rail yards; or passenger facilities such as stations and parking garages. Airport facilities include many of these same types, as well as aircraft hangars, terminals, fueling facilities and baggage handling facilities. Many facilities include major pieces of equipment (e.g., vehicle lifts) that may be inventoried separately or considered as part of the facility.
Like structures, facilities are typically complex, with many different components, and have a seemingly indefinite lifespan. Overall facilities lives are estimated as 50 to 100 years in models such as FTA’s Transit Economic Requirements Model (TERM) Lite (23). Similar to vehicles, in some cases facilities may be transferable to other owners, simplifying the calculation of a market value for a facility.
Transportation agencies manage various other assets not addressed in the classes discussed above, including:
- Drainage: this encompasses pipes, gutters, drains, retention/detention ponds, and others. Management of drainage assets is complicated by the fact that many are underground and difficult to inventory. Also, in many cases it may be difficult to establish maintenance responsibility for drainage assets.
- Geotechnical: NCHRP identifies four basic subclasses of constructed geotechnical assets (24). These are slopes, embankments, subgrade, and retaining walls. Agencies may also identify geohazard locations (e.g., potential rockfall locations) in an asset inventory. As in the case of drainage assets, it can be a challenge to establish an inventory of geotechnical assets. Typically, these assets are long-lived, with asset lives similar to structures.
- Bicycle and Pedestrian Assets: bike lanes, sidewalks, curb ramps, and other related features. These assets promote multimodal accessibility, and in some cases (e.g., curb ramps) may be needed to comply with the legal requirements such as the Americans with Disabilities Act (ADA). Typically these assets have lives similar to traffic and safety assets described above.
- Land: this includes right-of-way, land used for facilities, and other land owned by a transportation agency. Land is different from other transportation assets regarding calculation of asset value in that it is not assumed to depreciate. Also, methods established for calculating the market value of real estate are directly applicable for valuing land, with the additional complication that in many cases there is additional value associated with maintaining a corridor (e.g., for construction of a future transportation link or fiber optic cable). Transportation agencies typically do not calculate a value for their land for TAM applications given it does not vary as a function of TAM-related decisions. However, land value can be highly relevant for decisions where the privatization of assets is evaluated, or where the overall benefit of an asset to society is considered.