This section provides guidance for using asset value to support the applications summarized in Section 8.1. For each application it discusses pertinent considerations in the asset value calculation, notes relevant issues in interpreting the results, and provides one or more examples of agency practices.
The fundamental use of asset value is to communicate what assets an agency owns using currency as the common units across asset classes and components. All of the approaches for calculating value support this application.
Two examples of agency practice for communicating value in a TAMP are provided in Chapter 2: the City of Melbourne’s approach integrating asset value with other measures in a graphical view (7), and the approach used by Carver County, Minnesota to summarize asset replacement cost and current value in a table listing the different asset classes addressed in the TAMP (8).
Considerations for using asset value to summarize an agency’s inventory and current condition are as follows:
- Given there are different approaches for calculating value, it is important to summarize the basis for the value calculation – e.g., based on current replacement cost or historic costs.
- While all of the value approaches can be used for this application, as a practical matter, approaches based on the cost or market perspectives are preferred given they are easiest to calculate, communicate and explain. Regarding the cost perspective, current replacement cost is preferred over historic costs as the use of historic costs unadjusted for inflation may understate value from the perspective of an asset manager.
- The calculation of overall asset value lends itself to parsimonious approaches, such as performing the value calculation at a network level and avoiding calculations for any asset classes or components that would ultimately be aggregated when presenting the results. More granular details in the calculations should be introduced only if they are necessary to obtain an accurate overall value, or if they will help support other asset value applications.
- Where feasible, both the initial or “like new” value and current asset value should be communicated to distinguish between the potential value of the agency’s assets and the value given their remaining life. Any of the approaches discussed in Chapter 6 can be used to calculate depreciation in this case if a calculation is needed.
- When summarizing value across multiple asset classes, care should be taken to avoid double-counting asset value. Often the calculation of value for a complex asset includes multiple classes of assets. For instance, the value calculation for pavement may include costs for traffic and safety features such as signs, traffic signals and guardrails, and land. The calculation for track may include signals, electrification, small structures, and land. Before adding another asset class to the calculation, it is important to verify that its value has not already been included as part of another class.
The cost to maintain current asset value can be calculated using any of the asset valuation approaches. However, this measure is best supported when the initial asset value is calculated using current replacement cost or market value, and when depreciation is calculated using a condition-based approach. Also, to support an accurate calculation, assets should be represented at a sufficient level of detail for quantifying the costs and effects of major capital expenditures. In many cases this may suggest a need for defining asset components for bridges, facilities and/or other complex assets where a capital investment may focus on one portion of an asset.
As discussed in Chapter 7, the preferred approach for calculating the cost to maintain asset value uses an agency’s asset management systems to define a funding scenario in which conditions are maintained, and then use this scenario as the basis for stating the cost to maintain value. However, where this approach is impractical, the alternative is to calculate annual depreciation, and use this as an estimate of the cost to maintain.
If the asset valuation approach is overly simplified, then annual depreciation may prove to be a particularly poor proxy for the cost to maintain. For instance, if asset value is measured strictly based on historic costs and asset life is assumed to have a constant rate of decrease without regard to level of maintenance, then this limited approach would lead to a cost for maintaining value that is simply an equal amount each year, adjusted for annual inflation. Finding the appropriate level of detail in the valuation process has a great impact on how the valuation may be used.
Regardless of the specific approach for obtaining the cost to maintain, it is recommended that this measure be accompanied by ASR, defined here as planned expenditures divided by the cost to maintain current value. ASR is not a cost at all, but a ratio. Nonetheless, it is a useful measure for evaluating whether or not an asset owner is investing the necessary amount to maintain value, regardless of what that cost actually is.
Chapter 2 includes a description of the approach for reporting pavement ASR used by Washington State DOT (WSDOT) (10). This agency uses an approach described by FHWA (43) to estimate the additional life added to the system through pavement treatments and divides this by the life through deterioration to calculate ASR. This approach to calculating ASR does not involve an explicit calculation of ASR, but is consistent with the definition of the measure presented in Chapter 7.
Issues to consider when reporting the cost to maintain current asset value include:
- The approach used to calculate the measure should be noted because it impacts the potential applications of the cost and/or ASR.
It is important to clearly communicate what types of costs are included in the cost to maintain current value, and what types are excluded. For instance, it is common to exclude preventive maintenance costs from management system models and depreciation calculations, while assuming these activities will nonetheless continue to be performed. If annual depreciation is used, then the costs that are included will depend upon the specific set of treatments one has defined, as described in Chapter 5.
- If an agency has determined that following its life cycle strategies and achieving its desired state of good repair requires maintaining current conditions, then the cost to maintain current value may be the same as the amount of spending needed. Otherwise, the two may be different, such as when greater levels of spending are needed to maintain current value or when additional investment is needed to increase asset value. However even when the values are different it can be instructive to show both the cost to maintain and total need.
Determining the amount of money an agency needs to spend on its assets is inherently subjective. The calculation depends on the answer to the question “what constitutes a need?” and this question has many potential answers.
The Federal definition of asset management provides an approach for addressing what asset investments are defined as needs. The TAMP regulation (23 CFR 515.5) defines asset management as a process for identifying “…a structured sequence of maintenance, preservation, repair, rehabilitation, and replacement actions that will achieve and sustain a desired state of good repair over the life cycle of the assets at minimum practicable cost.” The regulations further require that agencies define a set of asset management objectives aligned with this definition, and perform a gap assessment relating actual conditions to agency two and four-year performance targets and the desired state of good repair. Once this desired state of good repair is established, the asset owner must establish which treatments are required to achieve and maintain the desired state at minimum cost.
The GASB 34 modified approach (1) provides similar flexibility. Agencies using the modified approach do not calculate depreciation for their infrastructure assets. Instead, they define a target level of service, and determine the cost to maintaining the target level. Provided the agency continues to maintain their assets at the target level of service, they can state the cost of maintaining the target level of service as an operating cost in their financial reports in lieu of depreciation.
The approach recommended here for establishing the level of investment needed for a set of assets is meant to be consistent with U.S. Federal TAMP regulations and the GASB 34 modified approach. That is, the asset owner should clearly define their desired state of good repair, and then base their calculation of needed funding on the funding required to achieve and maintain this state. This information can then be used to calculate and report AFR, planned funding divided by needed funding over a 10-year period.
However, how does required spending relate to asset value? In many cases, the needed level of spending will be similar to, if not the same as, the cost to maintain asset value. As discussed above, the two measures are not the same, but for a mature asset inventory that has reached a steady state and is being maintained in its desired state of good repair, the two may be very similar. Annual depreciation provides a rough approximation of the cost to maintain value, and thus may provide an approximation (albeit an even rougher one) of needed spending. Even when needed spending, the cost to maintain, and annual depreciation are all different, it can be helpful to communicate the three values and the differences between them to make the case for any necessary investments.
In the case where economic perspective is used as the basis for calculating asset value, an alternative approach may be appropriate for defining an assets’ needs and the cost to meet them. Any asset investment with a positive NPV provides a benefit to users and therefore may be considered needed by the agency. The cost of meeting needs is then the cost of performing all investments with a positive NPV over a defined period. This requires that the NPV calculations include other treatments for complex assets, such as rehabilitation of pavement, bridges and facilities.
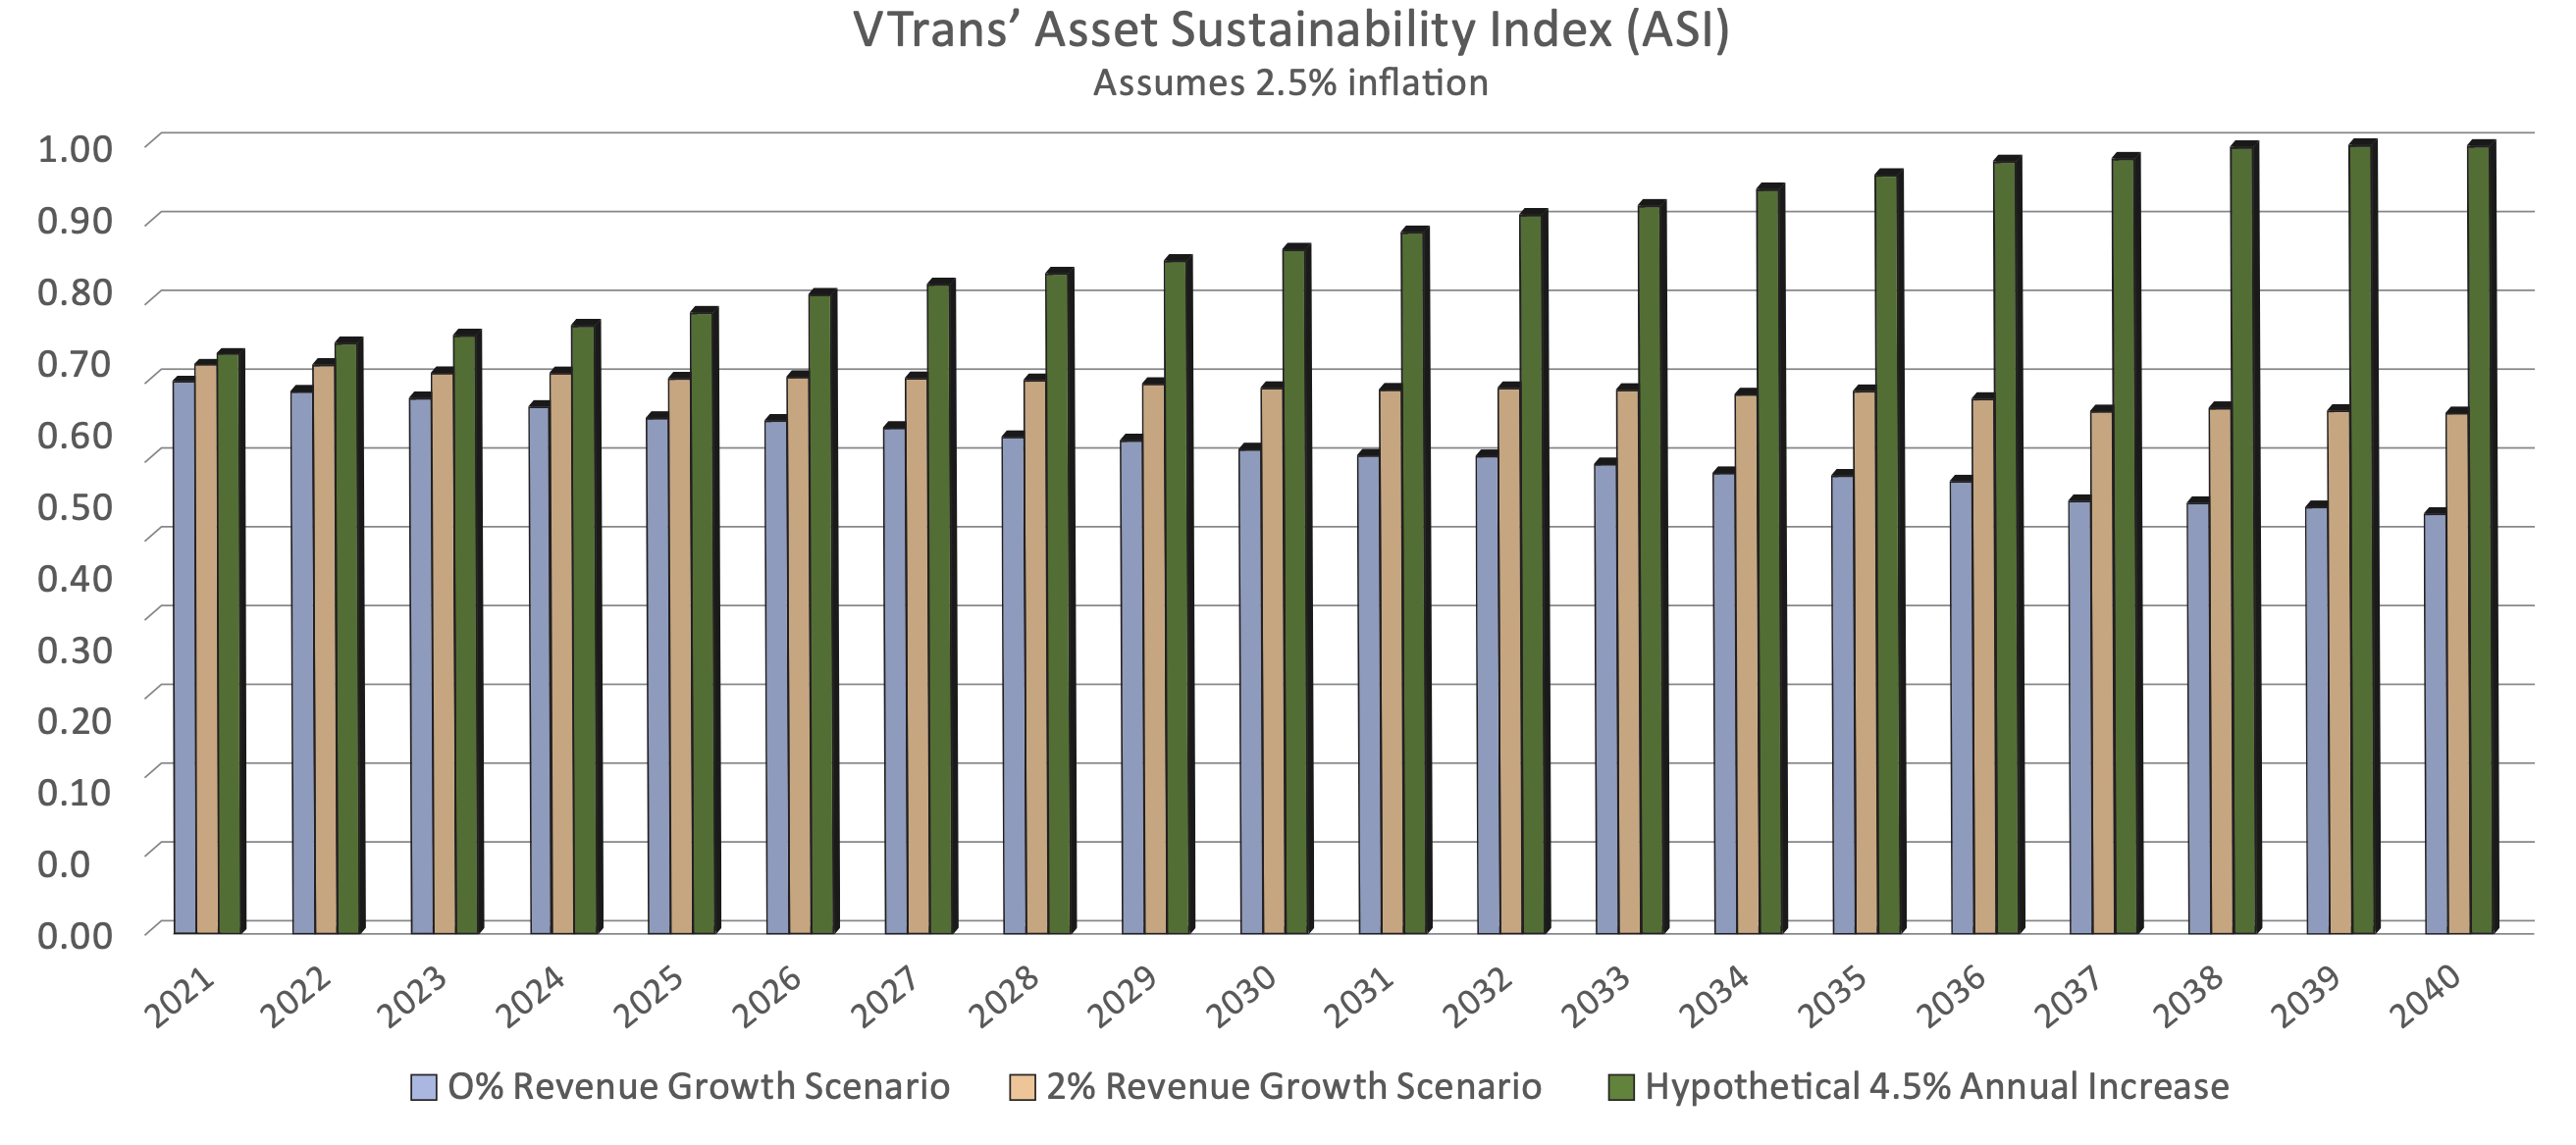
The example below shows how one agency has addressed the challenge of defining asset need. The Vermont Agency of Transportation (VTrans) summarizes needed funding in its TAMP using ASI (similar to AFR) and ACR (44). In its TAMP, VTrans uses the results for these measures to illustrate the impact of planned funding levels and show that available funding is less than what is needed to meet the agency’s needs.
VTrans defines asset sustainability index (ASI) as “the ratio of anticipated needs to anticipated revenues”. ASI demonstrates the percent of maintenance needs met by projected funds. ACR is used to weigh the impact of investment decisions on overall asset value.
VTrans develops graphs and tables to illustrate the transformation of the ASI under different scenarios. In the graph below, the blue bars reflect a 0% revenue growth scenario, the yellow bars indicate a 2% growth scenario, and the green bars represent a 4.5% growth scenario. The ASI clearly demonstrates how the agency will face growing funding deficits unless the budget is increased.
The VTrans TAMP includes tables displaying the ACR for bridge and pavement assets, see the 6th column in the table. By comparing the size of the investment with the resulting change in ACR, VTrans contextualizes the impact of each investment. The ACR is also used to identify which assets are in need of future investment. When a small percent of the asset’s life remains, more funds should be committed to renewing the asset or asset class.

Source: Vermont Agency of Transportation (44)
Issues to consider when determining needed funding include those identified previously for calculating the cost to maintain asset value. An additional consideration is the timeframe of the projection. An analysis period of 10 years or more is recommended when determining needed spending and AFR given there may be large variations in year-to-year spending which can obscure trends.
Information on asset value does not provide a direct indication of how an agency should invest in its assets. Ideally, an agency should use its management systems to define and select scenarios reflecting their preferred allocation of funding. However, asset value and related measures can clarify conditions and trends between different asset classes and groups of assets to support resource allocation decisions. For instance, an agency might show that increased investment is needed for a given asset class or system based on the asset’s overall value, the gap between current spending and spending needed to maintain asset value, a(nd/or other value-related measures.
All of the different approaches for calculating asset value can support decisions about how to allocate funding. However, asset value is most likely to relate to asset funding and conditions when:
- Complex assets are valued at a component level;
- Initial asset value is based on current replacement cost or market value;
- Effects of major treatments that improve asset condition are included in the calculation; and
- Depreciation is condition-based and condition data are collected and used for supporting allocation decisions.
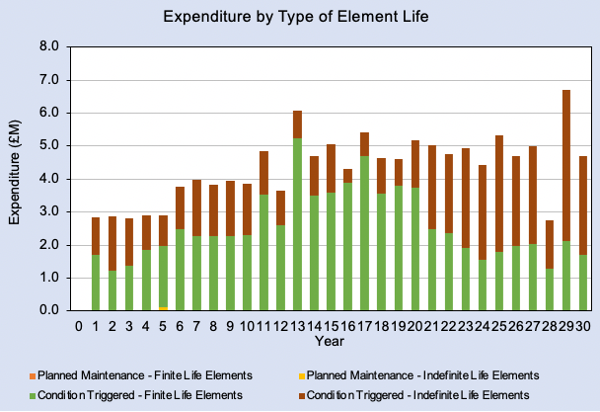
The callout box shows an example of how asset value can support resource allocation tools. It describes the Structures Asset Valuation and Investment (SAVI) Tool developed by the UK Department for Transport (45). The SAVI Tool is a spreadsheet tool that stores data on an inventory of bridges at the component level, calculates asset value using depreciated replacement cost, helps define a lifecycle strategy for bridges, and predicts future costs and conditions based on the selected lifecycle strategy. The tool includes a summary of asset value for different groups of bridges to support financial reporting and provide insights into recommended funding.
The SAVI tool is used by transportation practitioners in the UK to complete structural valuations, calculating replacement cost, depreciated replacement cost, accumulated depreciation, and annual depreciation values. The tool provides a consistent, national approach to managing and valuing asset structures based on the condition of the structures’ component elements. The tool’s beta testing finished in October 2019, and it was formally released at the Bridges 2020 conference in Coventry.
The SAVI tool uses the methods of valuation defined in Chartered Institute of Public Finance and Accountancy (CIPFA) guidance. Replacement cost is calculated using a unit cost per square meter, and depreciation is dictated by deterioration curves which provide an effective element age. Using these valuations, SAVI can develop long-term asset management plans (AMPs) up to 120 years, short-term plans up to five years, and intervention strategies. It can also model different budget scenarios.
The tool was designed in response to local agencies recognizing their need for a database to manage their asset inventory data which can return useful outputs and analysis. The SAVI tool supports several types of structures including bridges, culverts, tunnels, underpasses, lighting, retaining walls, road signs, signals, and reinforced earthworks. For each of these asset types, it requires detailed inventory and condition data as well as anticipated expenditures on routine and special maintenance. The tool can analyze up to 5,000 structures at once.
Three dashboards one for the valuation, one for the short-term AMP, and one for the long-term AMP supply summaries of the asset analysis and document the projected condition-based maintenance expenditures. A sample graph from the LAMP dashboard is included below. Additionally, a fourth page reports the element condition score for every element in the model for each year of analysis; it highlights when assets fall into disrepair and which assets are maintained in good condition.

Source: UK Road Liaison Group (45)
Asset value can provide useful supporting information when developing the strategy for maintaining an asset over its life cycle, as illustrated in the case of the SAVI Tool described here. Further, asset value can be used explicitly to compare life cycle strategies in two ways:
First, if an economic perspective is used as the basis for value, then calculations of asset value yield the NPV of an asset over its life cycle. NPV provides a quantitative measure that can be used to compare different scenarios to establish the preferred life cycle strategy for an asset. To compare different life cycle strategies, the asset valuation must meet the additional requirement of distinguishing between the different treatments being considered, such as rehabilitation treatments for pavements, bridges, facilities and other complex assets.
Alternatively, if a cost or market perspective is used as the basis for value, asset value can be used as the residual value of an asset for calculations of asset life cycle cost, as illustrated in the example in Chapter 2. This provides an approach for quantifying the differences between two strategies where one strategy results in a different remaining life or condition at the end of the analysis period.
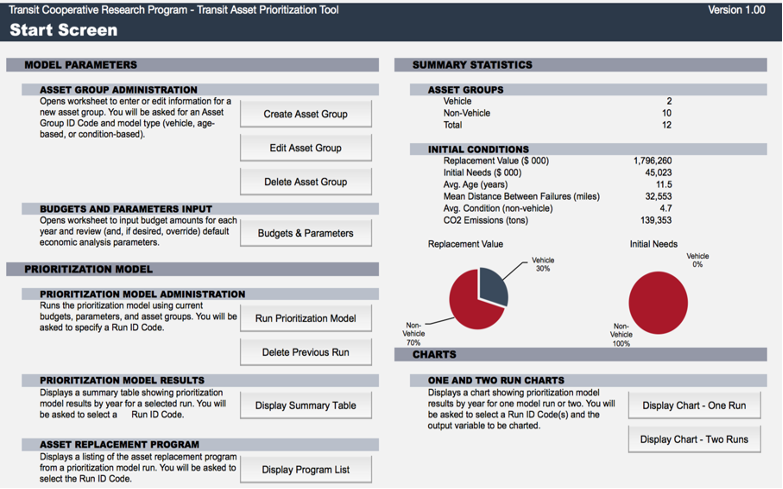
The Transit Asset Prioritization Tool (TAPT) included with TCRP Report 172 (46) illustrates use of asset value – or more specifically, the NPV of an asset – to establish a life cycle strategy. The tool is described in the callout box. The tool recommends a simplified life cycle strategy for each asset class (that is, when to replace the asset) based on the NPV of the asset. The strategy with the lowest NPV is selected for each asset class. In addition, the tool reports total NPV for all assets when generating scenarios of future asset conditions.
The Transit Asset Prioritization Tool (TAPT) is an analytical tool for analyzing and prioritizing investment needs for maintaining transit assets in a state of good repair. The tool includes three types of asset models: a mileage-based model intended for use with revenue vehicles; a condition-based model for use where an asset’s remaining life can be approximated based on condition; and an age-based based model for other asset classes. The tool user creates a set of asset class models using the three model types.
Each asset model predicts the agency and user costs associated with an asset over its life cycle. Also, the models predict when to replace an asset. The benefit of replacement is calculated as the increase in NPV that results from from replacing the asset at a given age relative to deferring replacement for one year. TAPT uses the asset class models to predict asset investment needs, and simulate conditions over time given a specified budget. One of the measures predicted for an analysis is the NPV of asset investments simulated as occurring in each period of the analysis.
Source: TCRP Report 172 (46).
The final application of asset value for supporting TAM is the calculation of the value derived from an asset. Often times an asset manager is not specifically concerned with this question, because in many instances it may be taken as a given that the assets one manages are, indeed, necessary and important, and the asset manager cares primarily about how best to manage a set of assets given this assumption. However, in some cases the asset manager may be specifically interested in the value derived from one asset versus another and/or whether a given asset merits further investment. For example, when considering how to prioritize assets for resilience investments, one may wish to consider the degree to which different potential assets will reduce the likelihood of risk and the consequences of a possible asset failure, with consequences quantified based on the value of the asset to society.
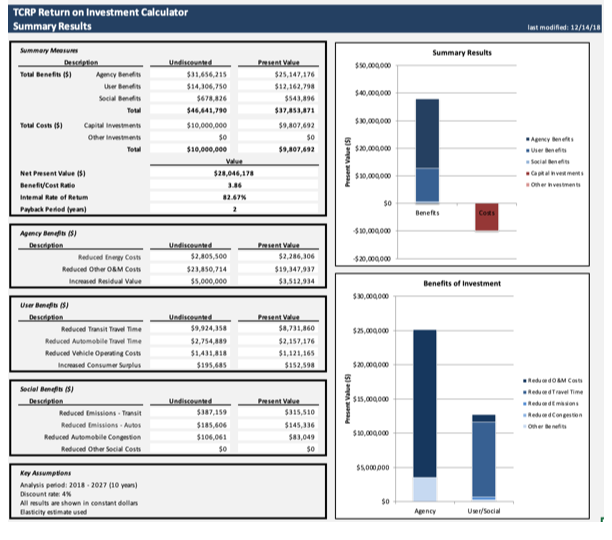
The callout box provides an example of how the value from a set of assets can support TAM. The Return on Investment (ROI) Calculator described in TCRP Report 206 (47) calculates the overall ROI of planned investments to achieve a state of good repair for transit assets. The tool allows one to compare different investment scenarios, producing measures of investment including NPV, Benefit Cost Ratio (BCR), and Internal Rate of Return (IRR).
Determining the “value from” is the central issue that the economic perspective of asset value is intended to address. Thus, for further discussion of this application the reader should refer to the discussion in Chapter 4 and the supporting appendices.
TCRP Report 206 presents a framework and approach for calculating the return on investment (ROI) of investments in transit assets to achieve and maintain a state of good repair. The report describes how to calculate the value of transit asset investments to a transit agency, transit system users, and society. It includes an ROI calculation tool one can use to calculate and compare different investment scenarios, such as to compare a scenario in which assets are maintained in good repair to one in which asset investments are deferred. Measures calculated using the tool include NPV, Benefit/Cost Ratio, Internal Rate of Return and Payback Period.
Source: TCRP Report 206 (47)


