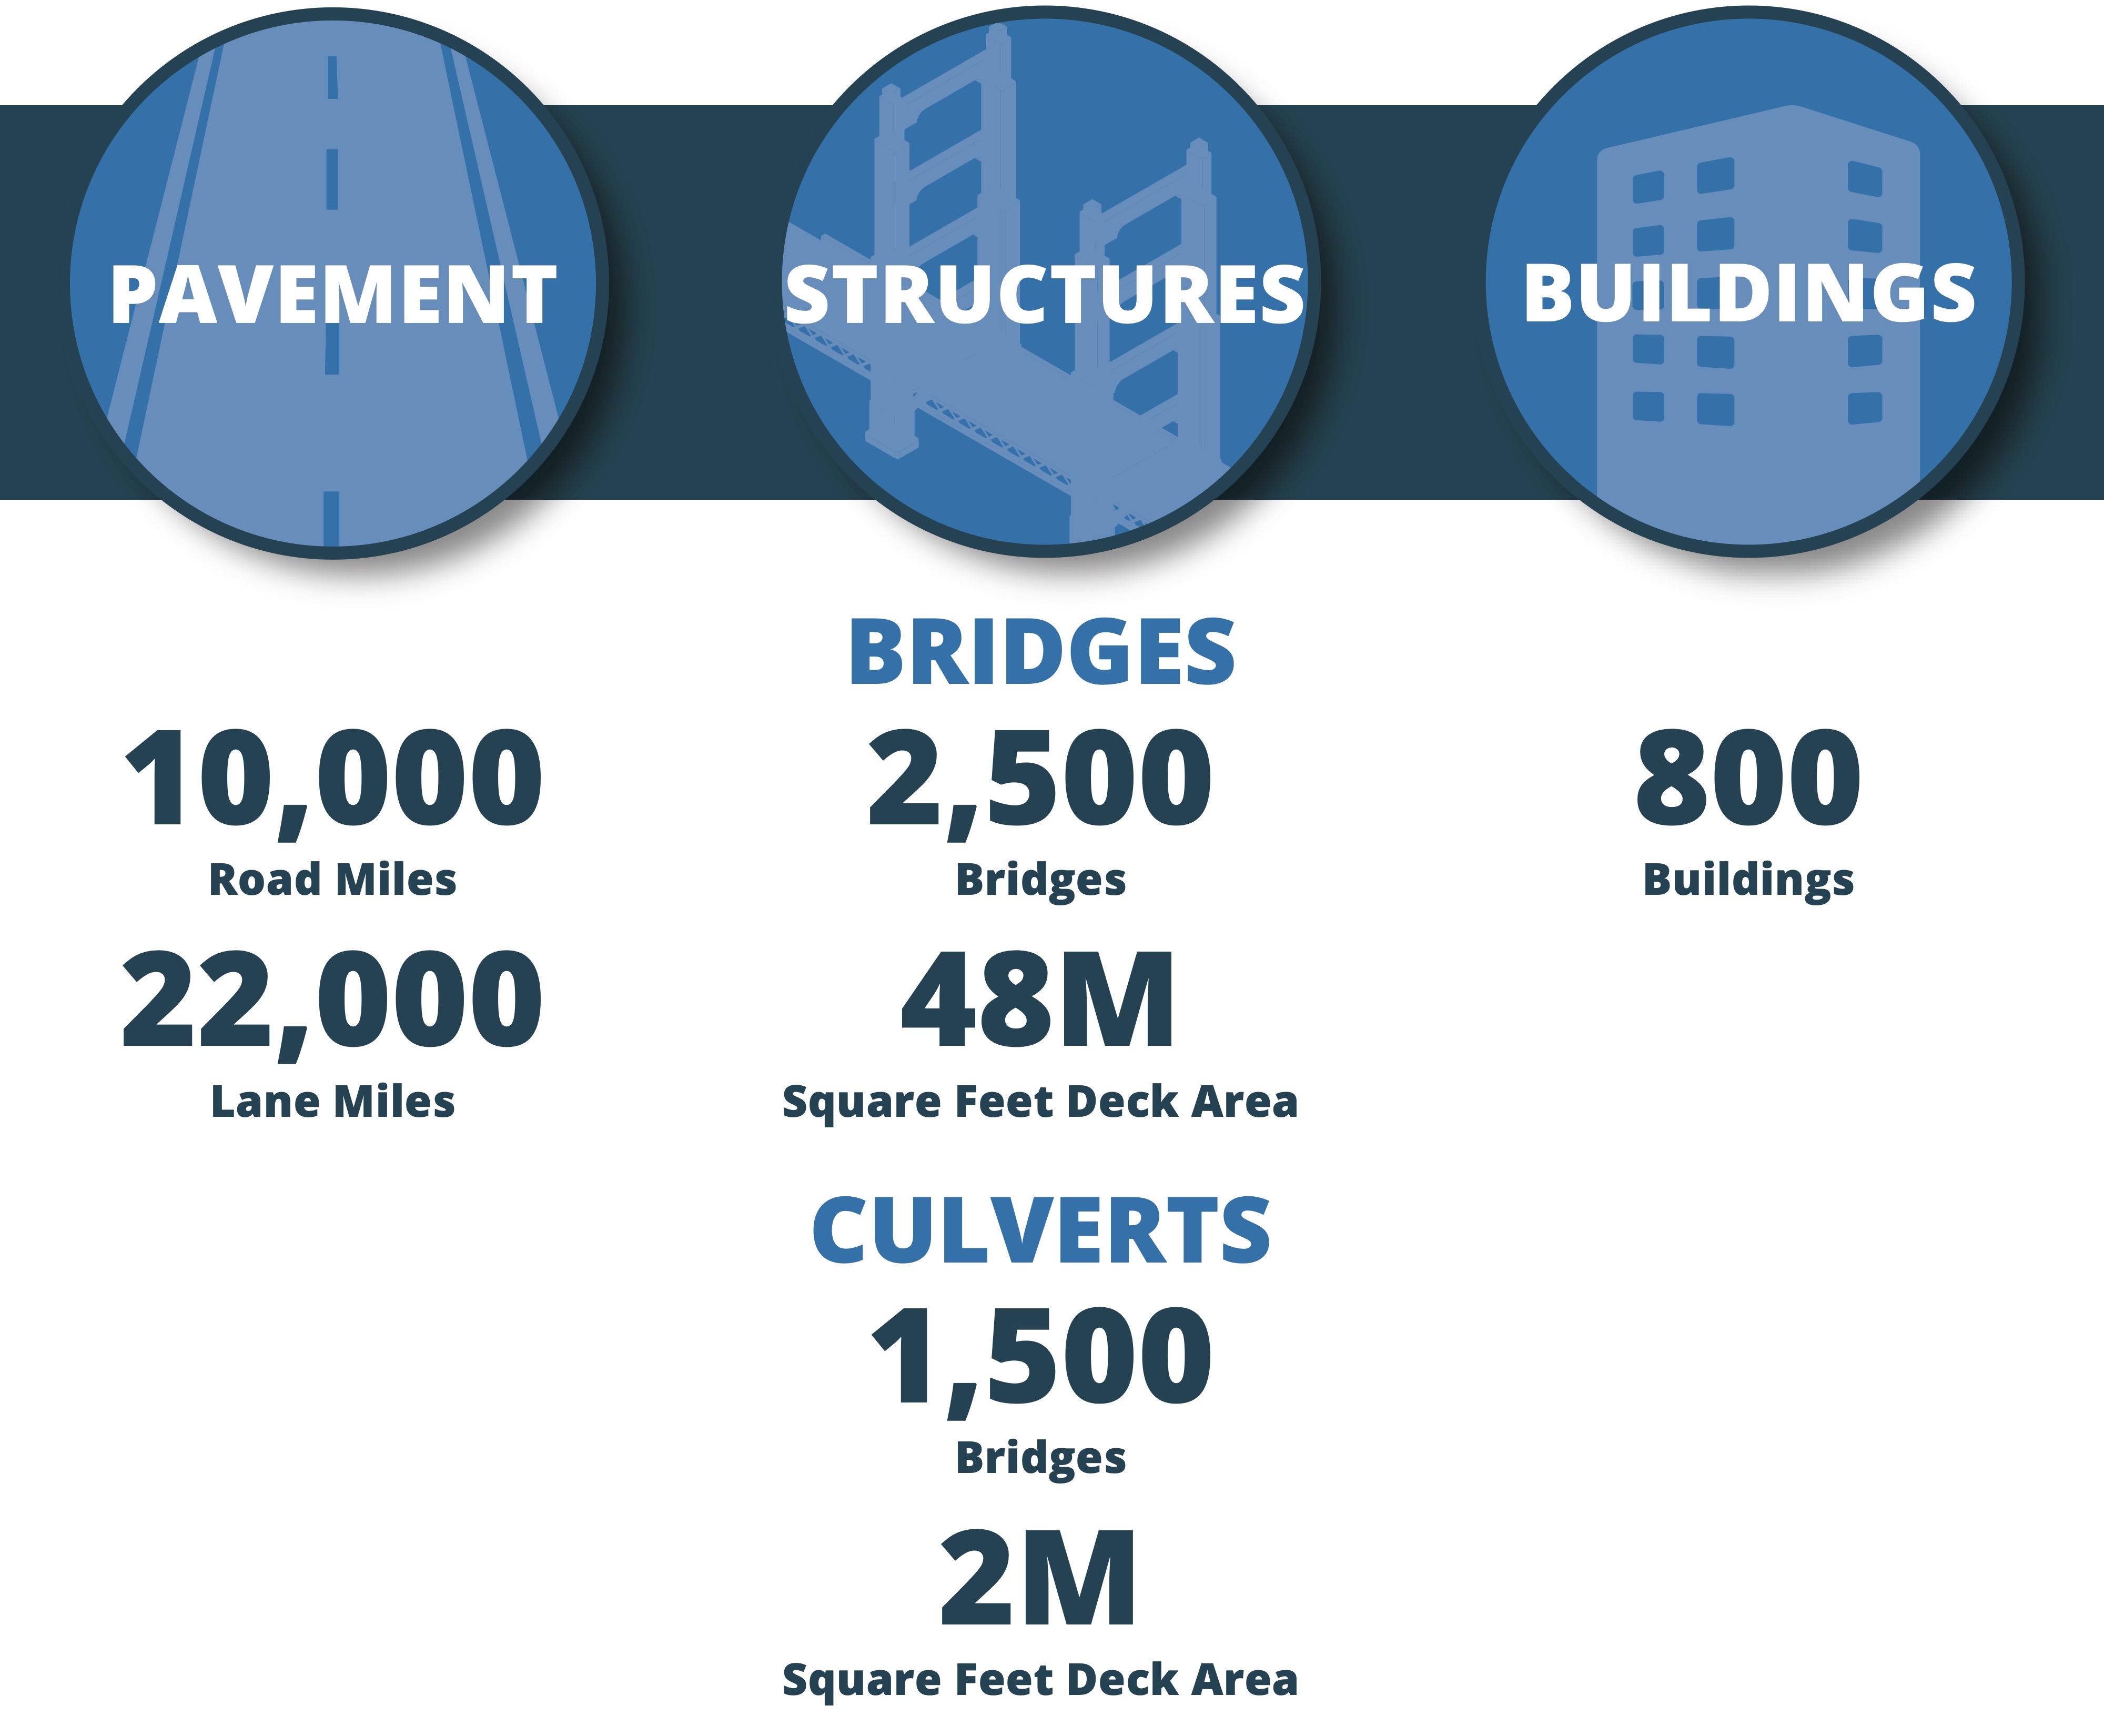
In this example, a highway agency in the Northern U.S., labeled “The Northern Agency,” is interested in calculating asset value and related measures to report for highway-related assets in its TAMP. Note, this example is adapted from tests with two different agencies, and is not intended to be representative of any actual agency.
Following the process outlined in Section 2, the agency first establishes that its goal is to establish overall value and related measures for three asset classes: pavement; structures (including bridges and bridge-length culverts); and buildings. The agency has data at the asset-level for each asset class. For pavement and structures, the agency has detailed condition data. For buildings, the agency has only summary inventory data, but its facility division has separately established insurance values representing the amount each building is insured for in the event of a catastrophic event, independent of the value of land or the equipment in each building.
For their structures, the agency decides that asset value should be computed at a component level, given that different structure components have different useful lives and condition data are available to support the calculation. Bridges are represented using three components: the bridge deck, superstructure and substructure. Bridge-length culverts are represented as a single component.
The following subsections describe the approach used for Steps 2 to 4 of the asset value calculation by asset class, followed by a summary of the results.
Pavement
Using the flow chart in Chapter 4 the agency decides that initial value for pavement should be based on replacement cost, given there is no need to maintain consistency with the approach used for financial reporting (based on historic costs), no specific need to calculate value of the asset class to society (which would suggest a need for calculating economic value), nor is there a market value that may be readily determined as an alternative.
Next, the agency reviews its treatment strategy for pavements. Initial construction of pavement is estimated to cost $1.4 million per lane mile. When a pavement section reaches the end of its useful life it is reconstructed at a cost of approximately $1 million per lane mile, restoring it to “like new” condition. Various treatments are performed over a pavement’s life, and their effects are reflected in the Pavement Condition Index (PCI) at any given time. PCI is an agency-specific measure of pavement condition. It combines different pavement distresses into a scale from 0% (worst condition) to 100% (best condition).
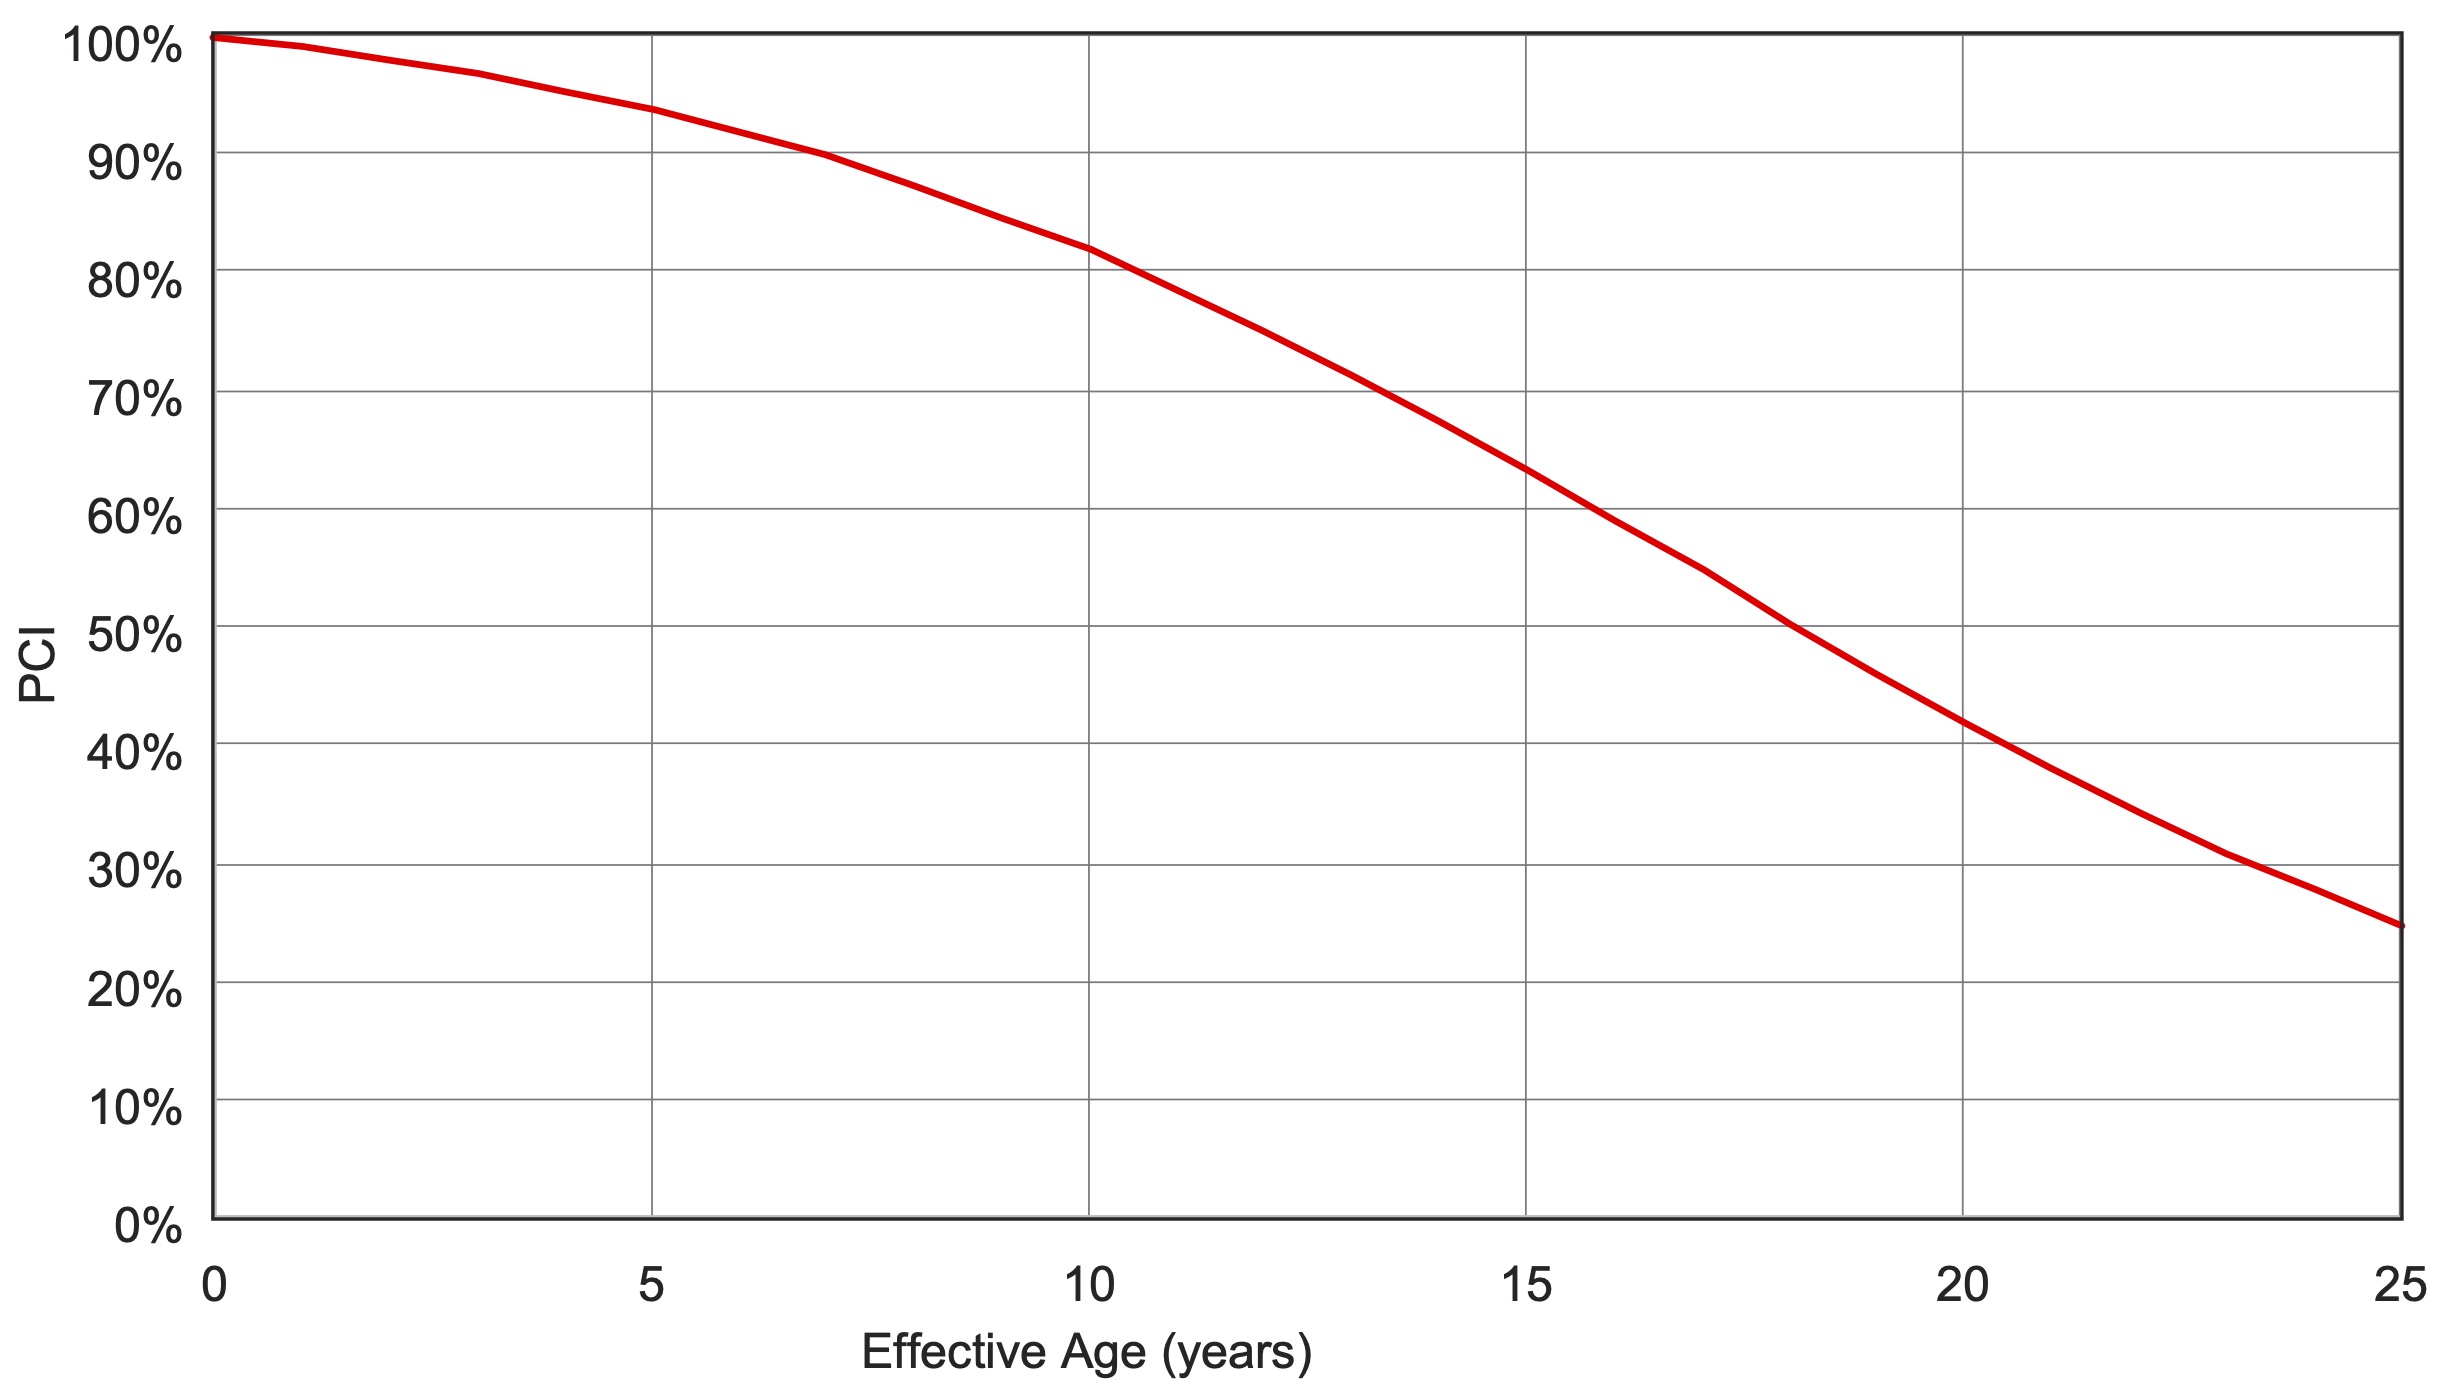
Given their use of the replacement cost approach to calculate initial value and PCI to capture condition, the agency determines it is not necessary to incorporate other treatments in the calculation of asset value besides pavement construction and reconstruction. Based on the agency’s life cycle strategy, the pavement is deemed to reach the end of its useful life when its PCI is reaches a value of 25%, which typically occurs at an age of approximately 25 years, as depicted in the deterioration curve shown in Figure 9-2. The pavement assets’ residual value is estimated to be $0.4 million per lane mile, equal to the difference in cost between initial construction and reconstruction.
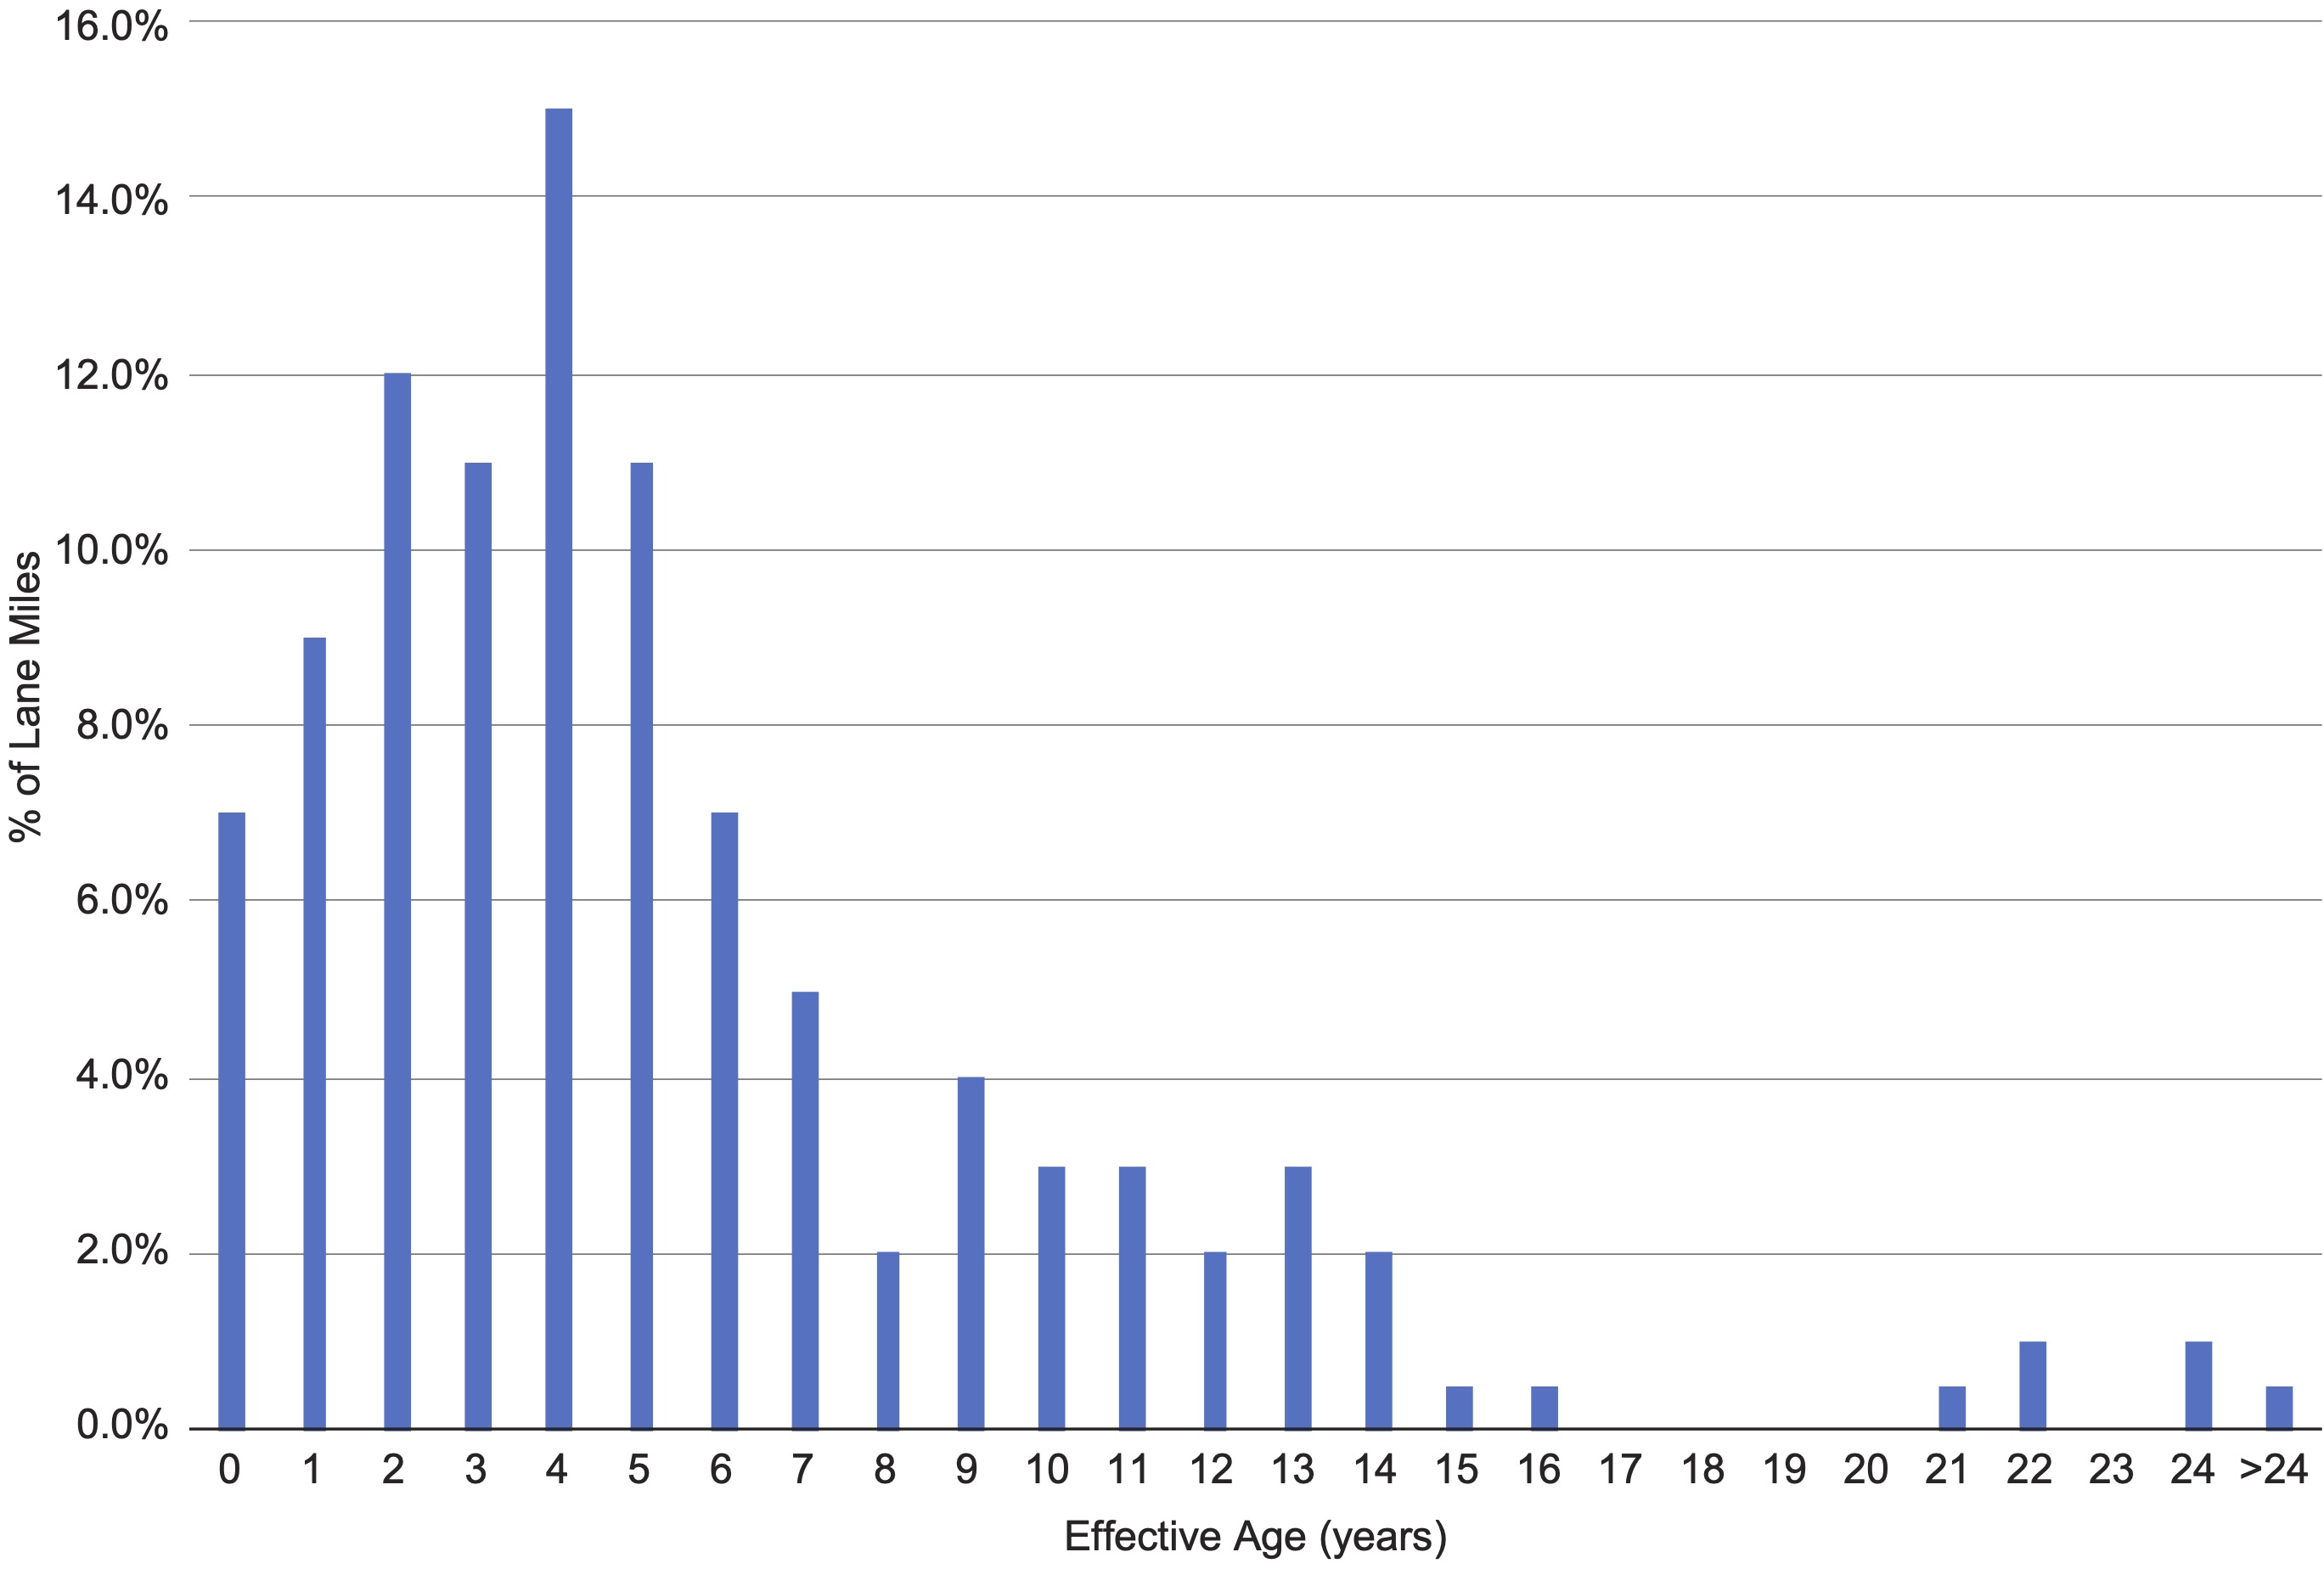
Then, the agency considers how to calculate depreciation. Reviewing the flow chart in Chapter 6, the agency decides to use a condition-based approach for calculating depreciation. The PCI of a pavement section estimates the effective life remaining where condition data are available. Where data are unavailable, the asset’s actual age is used. Figure 9-3 summarizes the distribution of pavement condition, depicting the percentage of pavement lane miles for each effective age from zero to over 24. Most of the assets have an effective age of under five years.
The agency uses the above information to calculate the value of its pavement. Initial value is approximately $30.8 billion (22,000 lane miles x $1.4 million per lane mile). For each section, depreciation is calculated based on the effective age using the depreciation formula for the condition-based approach, provided in Chapter 6. The result is that current pavement value is calculated as $26.0 billion with annual depreciation equal to $876 million. Annual depreciation is calculated by aging each pavement section by an additional year and noting the resulting change in value.
Structures
After completing the pavement valuation, the agency walks through the same process outlined above for structures, considering each of the bridge components defined. As in the case of pavement, the agency decides that initial value should be based on replacement cost.
The agency next reviews its treatment strategy for bridges and bridge-length culverts. The construction of a bridge or culvert costs approximately $280 per square foot of deck area. Replacing a structure has a similar cost. The approximate costs for replacing bridge decks, superstructures and substructures are established based on a pro-rated share of the total bridge replacement cost, considering the relative costs of replacing the component parts. Based on these historic costs, the bridge deck replacement is estimated to be 25% of the value of the bridge, the superstructure is estimated to be 40% of the value, and the substructure is estimated to be 35% of the value. Various treatments are performed over the life of a component, and their effects are reflected in the component conditions ratings. These are measured on the 0 to 9 scale defined for the NBI. When a component has reached the end of its useful life either the component is replaced or the entire structure may be replaced.
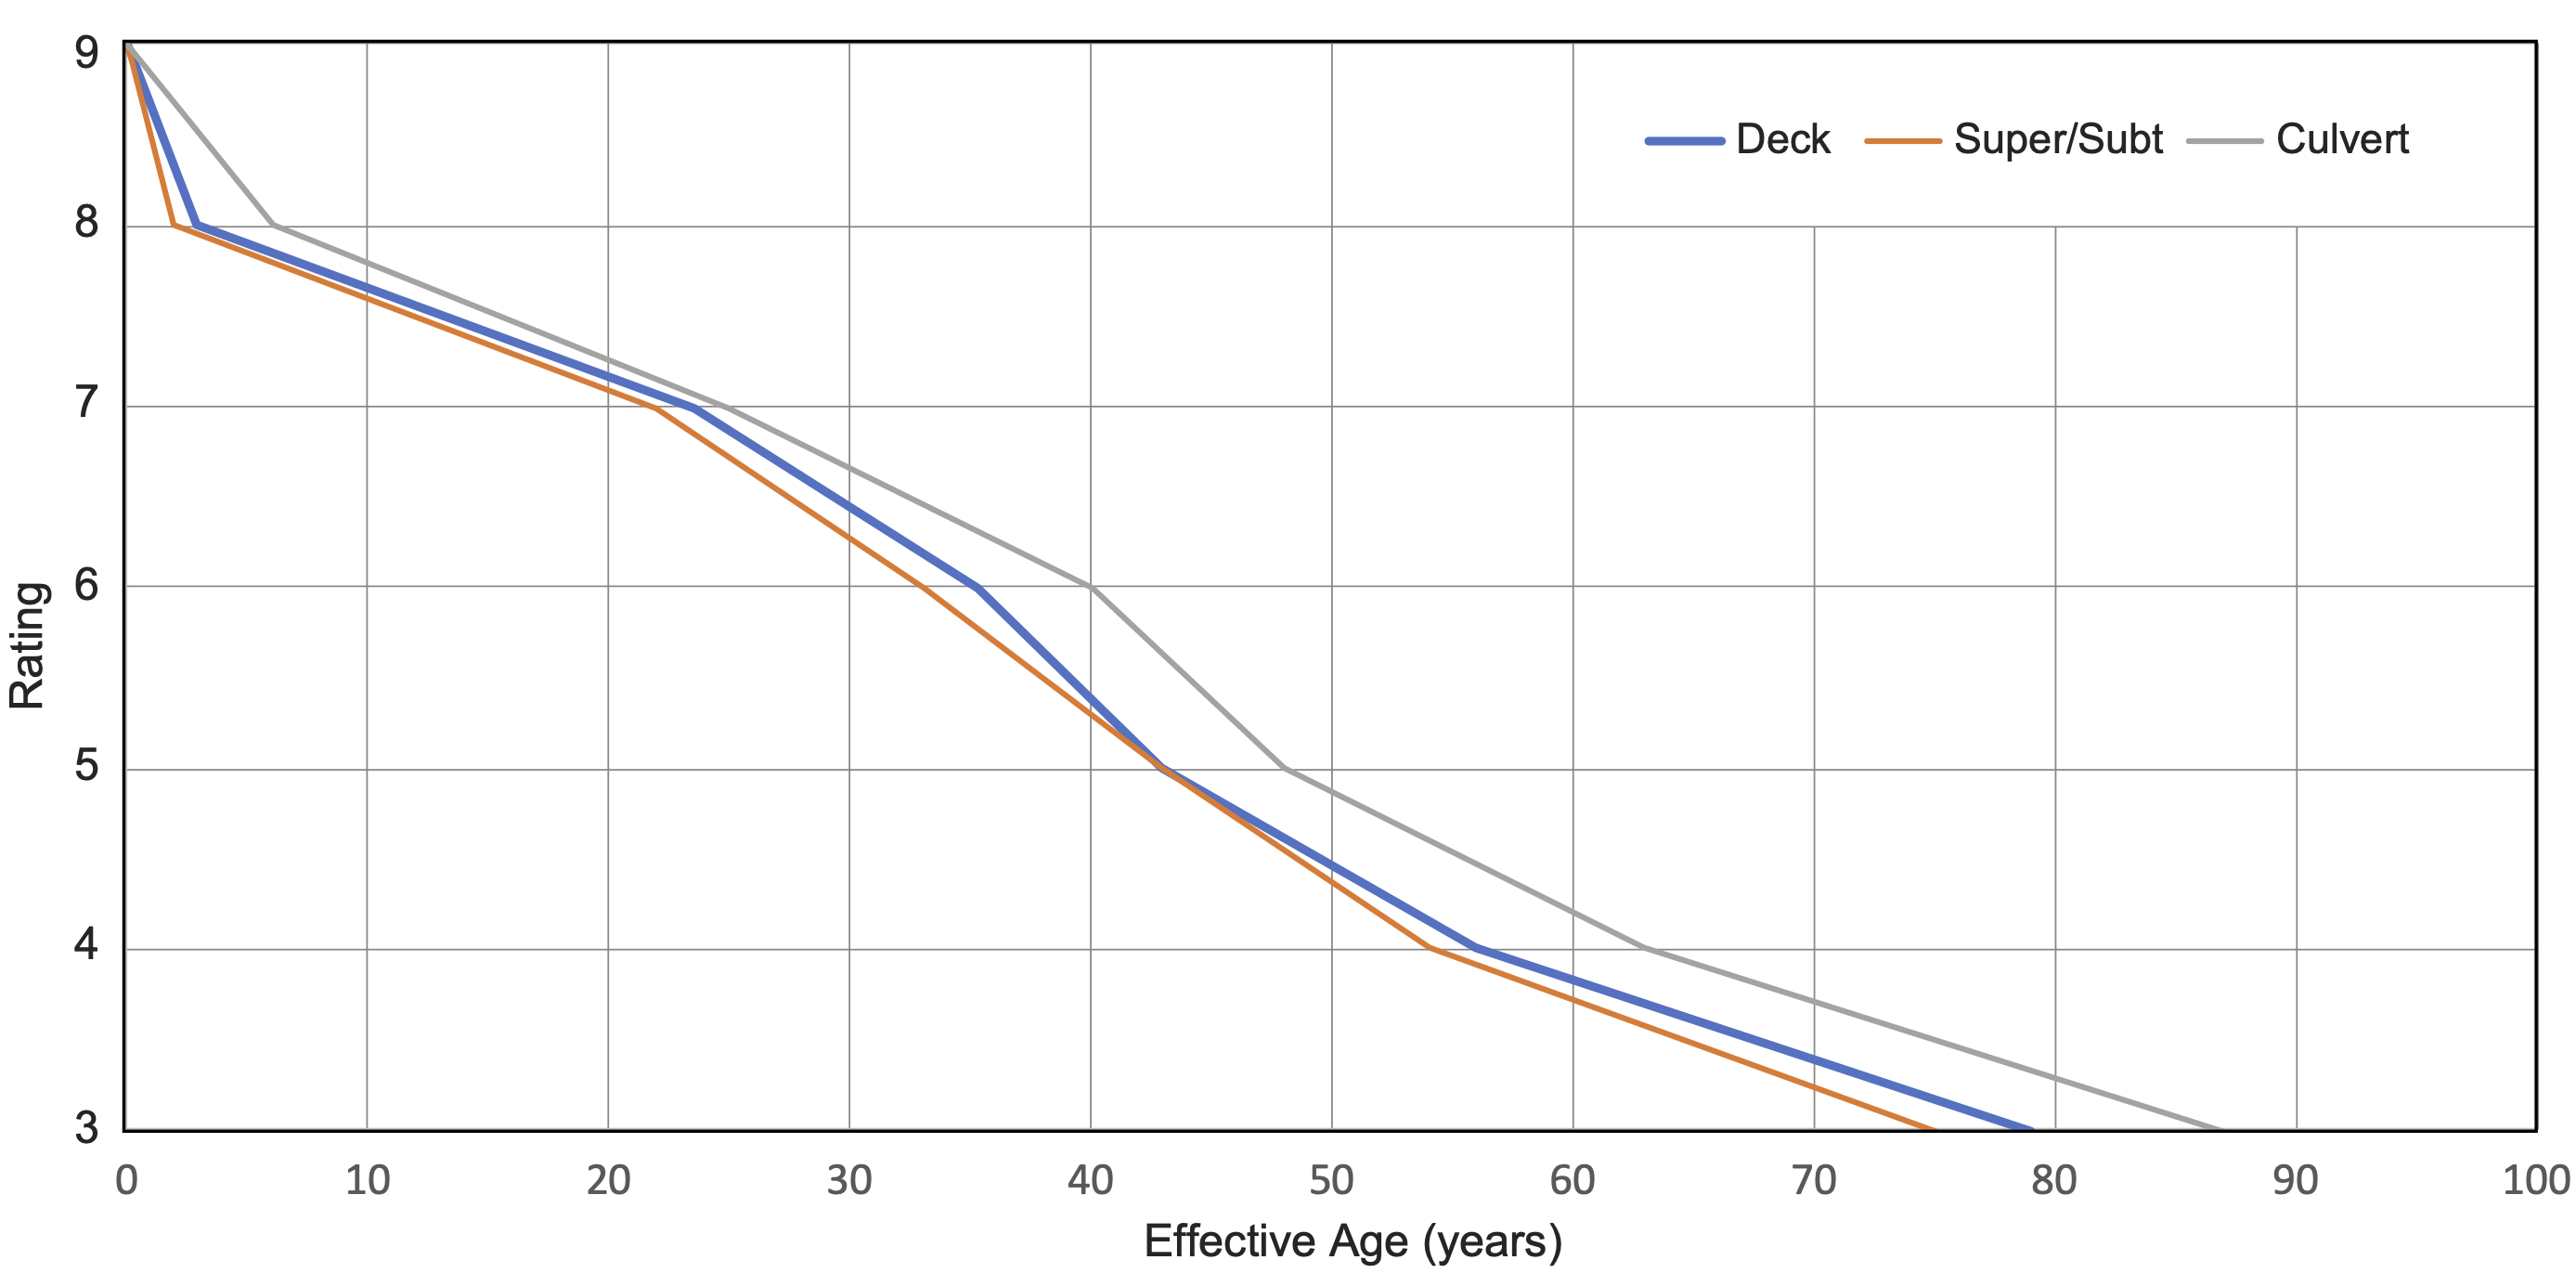
Given the incorporation of the component condition ratings into the NBI, the agency determines it is not necessary to include any treatments in the calculation of asset value besides initial construction and component or bridge replacement. Based on the agency’s life cycle strategy, a bridge deck is deemed to be at the end of its useful life when it has a rating of 4 or less on the NBI scale. For the superstructure, substructure and culverts, the component is deemed to be at the end of its useful life when it has a rating of 3 or less. Figure 9-4 illustrates the agency’s deterioration curves depicting the effective age of a component as a function of its condition rating. The agency developed these curves for use in their management systems based on an analysis of historic bridge inspection data. Three curves are shown in the figure: one for decks; a second used for both superstructure and substructure; and a third curve for culverts.
The agency further establishes that a portion of its bridges are built to outdated functional standards for load capacity and clearances. These bridges are deemed to be at the end of their useful life regardless of their physical condition. Thus, these bridges are treated as fully depreciated when calculating their asset value.
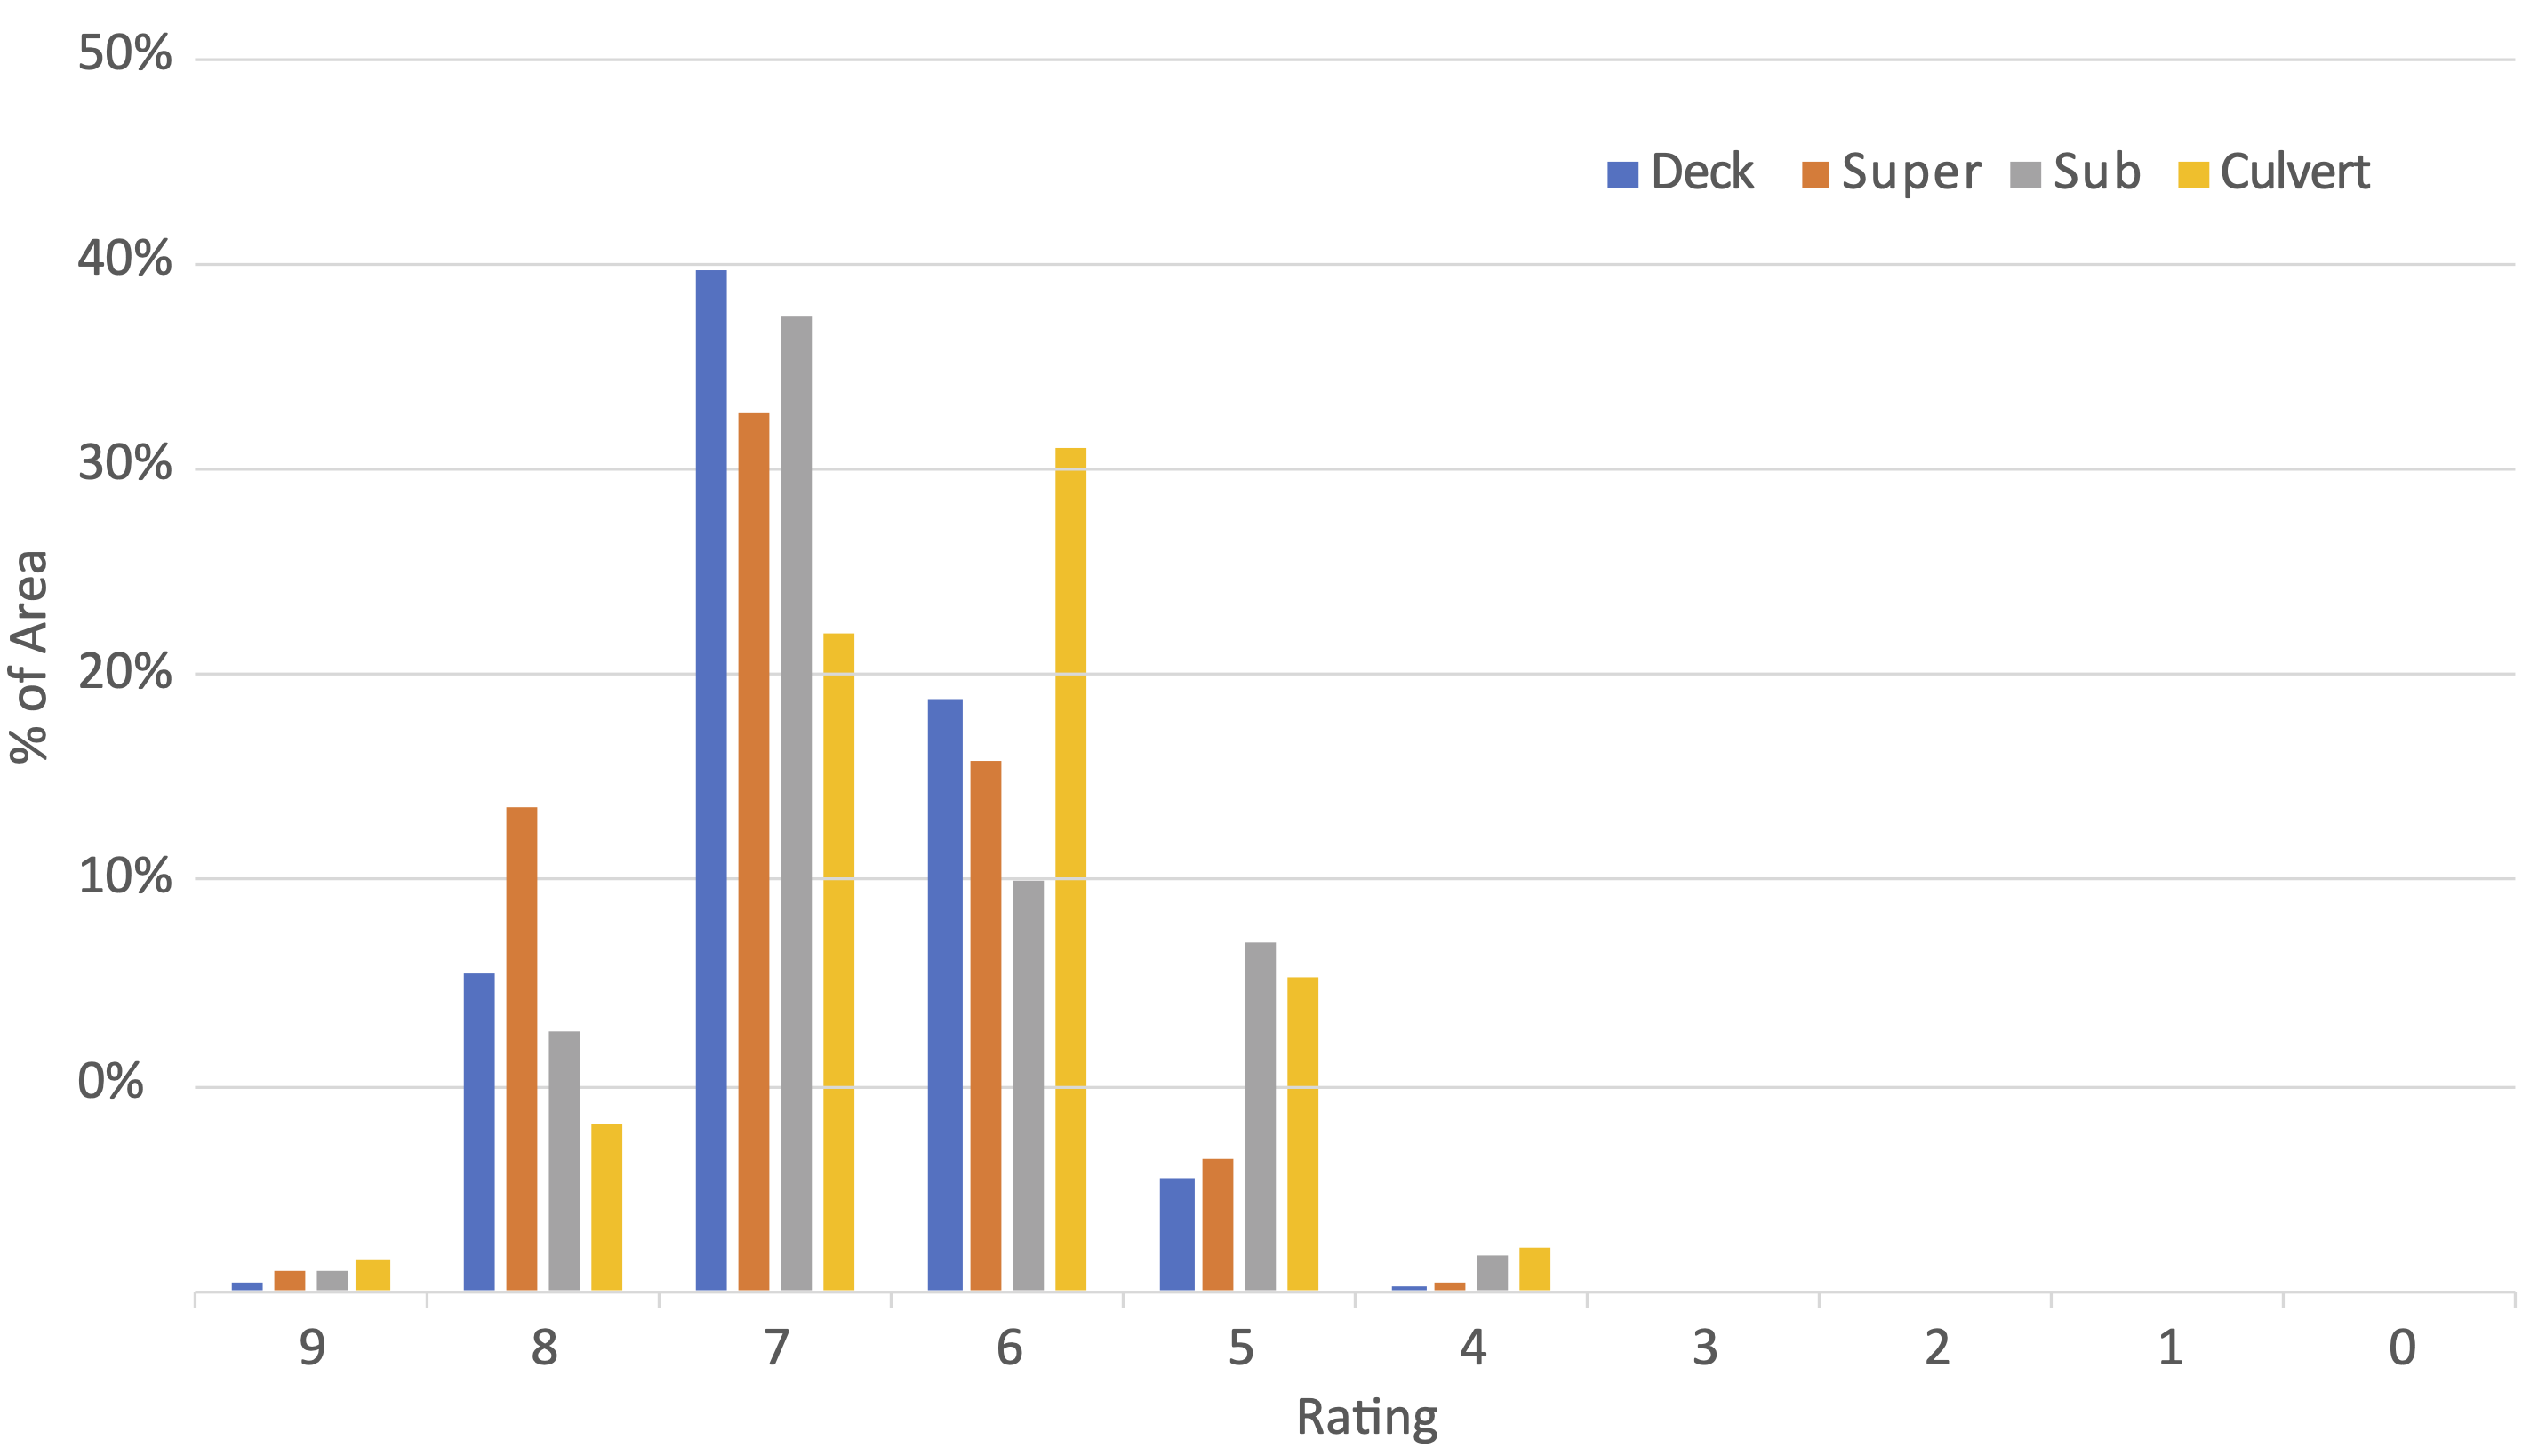
The agency then considers how to calculate depreciation. As in the case of pavement assets, the agency decides to use a condition-based approach. The NBI component rating is used to establish effective age. Figure 9-5 summarizes the distribution of conditions, depicting the percentage of each component in each condition rating (exempting functionally obsolete structures).
Lastly, the agency uses the approach described above to calculate value. Initial value is approximately $14.0 billion (50 million square feet x $280 per square foot). The calculations of current value are made by component, grouping all of the components of a given rating together (and exempting the obsolete bridges). For each rating group, effective age is estimated using the agency’s deterioration curves, and then depreciation is calculated using the depreciation formula provided for the condition-based approach in Chapter 6. The result is a current structure value of $8.8 billion. With annual depreciation equal to $193 million; this can be calculated by aging each group by an additional year and noting the resulting change in value.
Buildings
For its buildings, the agency has more limited condition data than it has for pavement and structures. However, as noted above, in addition to its data on the building inventory, the agency has data on the insured value of each of its buildings. The agency decides to use this insured value as a proxy for market value. The agency thereby establishes that the insured values of its buildings totals $0.9 billion.
The agency establishes the cost to replace all of its buildings would be approximately $1.2 billion, and that buildings are estimated to have a useful life of 60 years. The agency determines that an age-based approach should be used for depreciation if it is necessary to further depreciate the market value. Annual depreciation is estimated at approximately $20 million (equal to the replacement cost of $1.2 billion divided by the useful life of 60 years).
Results Summary
Table 9-1 summarizes the results of the asset value calculation. For each asset class, it shows the replacement cost, current value, ACR, and annual depreciation. The total replacement cost for all of the Northern Agency’s highway assets totals $46 billion. Considering the effects of depreciation, the current value of the inventory is $35.7 billion, resulting in an ACR of 0.78. Note there is no specific target value for ACR, but ideally this measure is maintained or increased over time. Absent investment to increase asset value, the inventory is expected to depreciate approximately $1.1 billion per year. This estimate of annual depreciation can be used as an estimate of the Cost to Maintain Value, though as described in Chapter 7 this cost should ideally be calculated using an agency’s asset management systems.
Table 9-1. Summary Results for the Northern Agency
| Asset Class | Subclass | Replacement Cost ($ billion) | Current Value ($ billion) | Asset Consumption Ratio (ACR) | Annual Depreciation |
|---|---|---|---|---|---|
| Pavement | 30.8 | 26.0 | 0.84 | 876 | |
| Structures | Bridges | 13.4 | 8.5 | 0.63 | 187 |
| Culverts | 0.6 | 0.3 | 0.61 | 6 | |
| Subtotal | 14.0 | 8.8 | 0.63 | 193 | |
| Buildings | 1.2 | 0.9 | 0.75 | 20 | |
| Total | 46.0 | 35.7 | 0.78 | 1,089 | |
