New Case Studies
Case Studies Added Under NCHRP Project 20-44(46)
| Section | Topic | Assets |
|---|---|---|
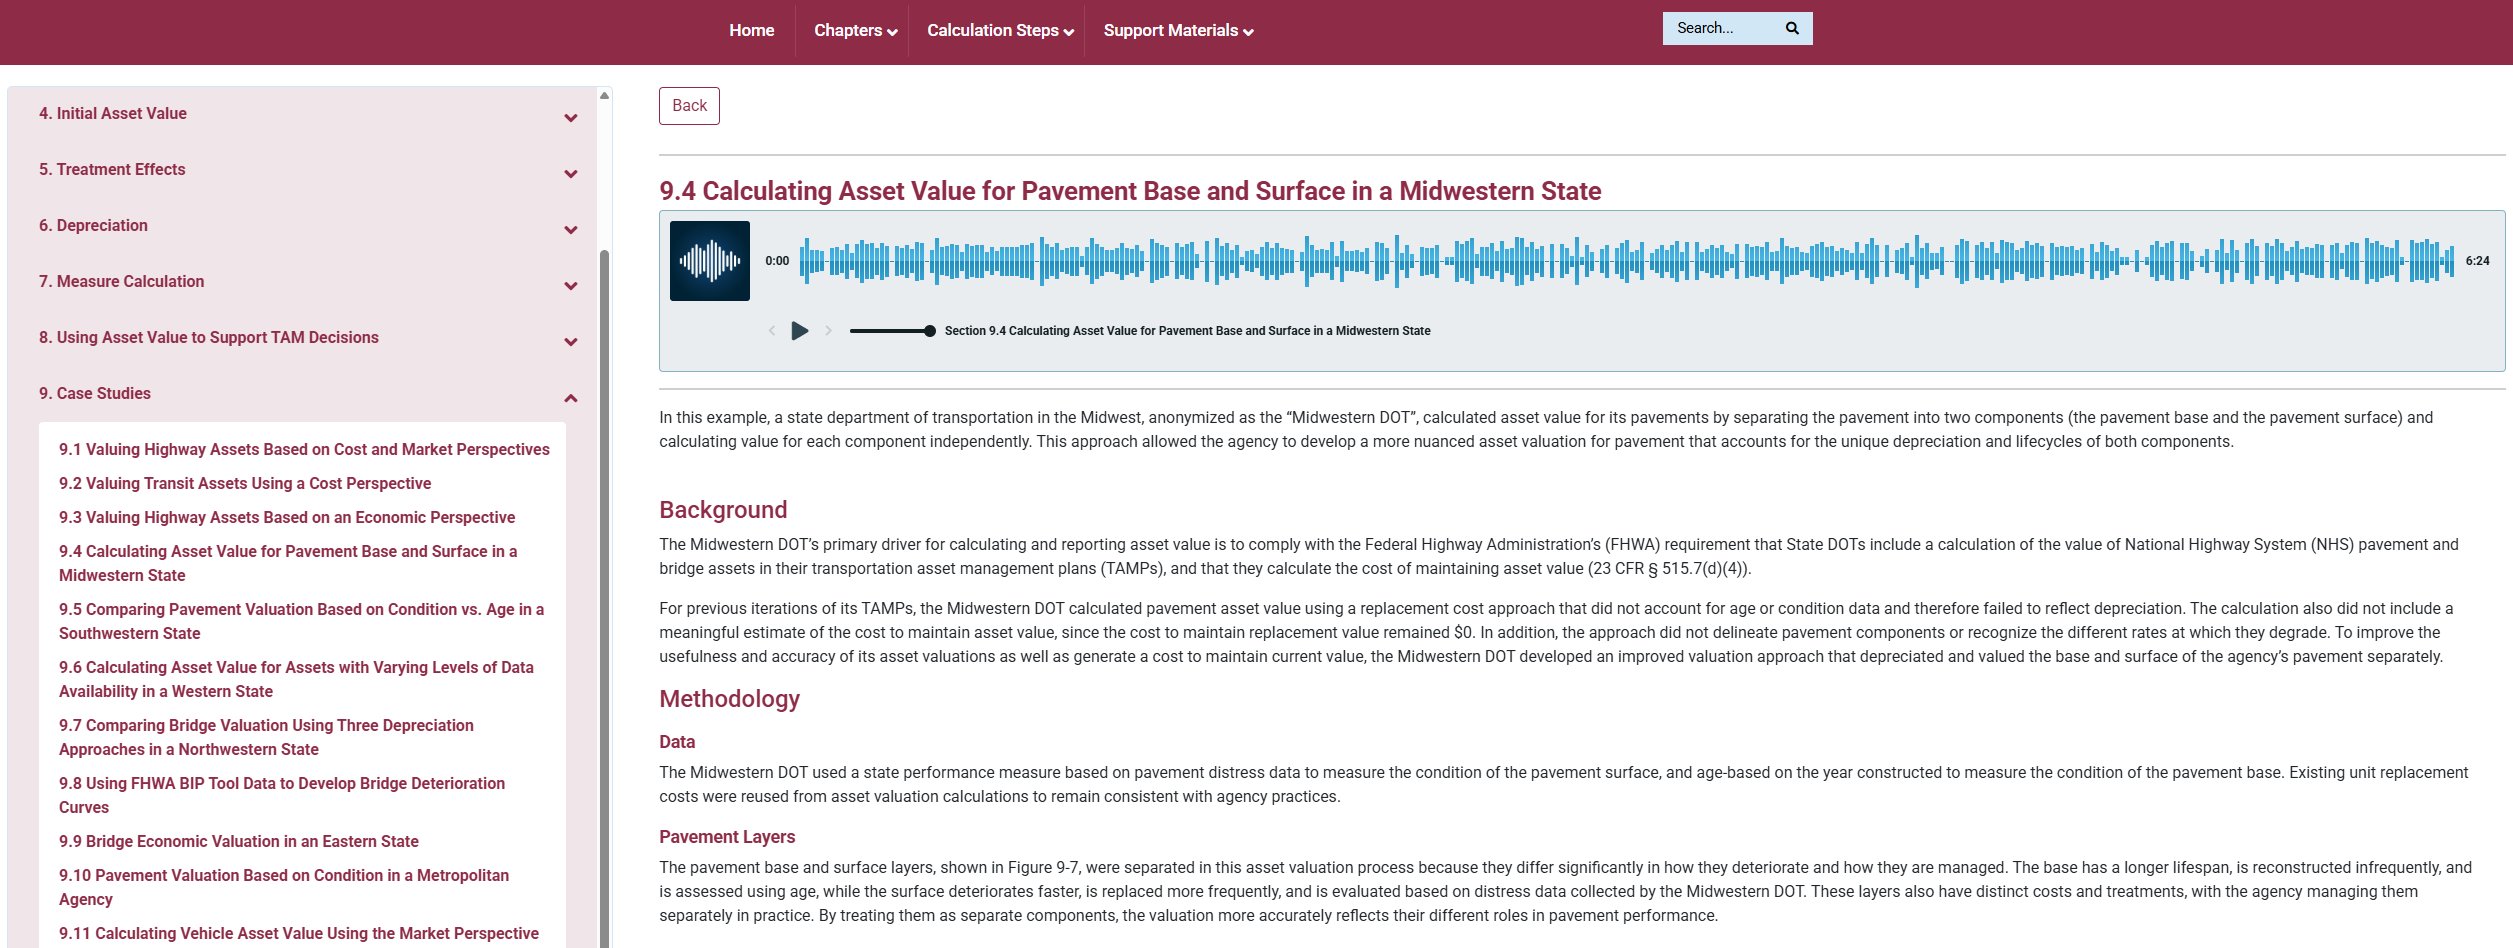
| 9.4 | Calculating Asset Value for Pavement Base and Surface in a Midwestern Agency | Pavement |
| 9.5 | Comparing Pavement Valuation Based on Condition vs. Age in a Southwestern Agency | Pavement |
| 9.6 | Calculating Asset Value for Assets with Varying Levels of Data Availability in a Western Agency | Multiple asset types |
| 9.7 | Comparing Bridge Valuation Using Three Depreciation Approaches in a Northwestern Agency | Bridge |
| 9.8 | Using FHWA BIP Tool Data to Develop Bridge Deterioration Curves | Bridge |
| 9.9 | Valuing a Bridge Using the Economic Perspective in an Eastern Agency | Bridge |
| 9.10 | Valuing Pavement Based on Condition in a Metropolitan Agency | Pavement |
| 9.11 | Calculating Vehicle Asset Value Using the Market Perspective | Cutaway Bus |
| 9.12 | Valuing Highway Assets Using the Economic Perspective in a Western Agency | Pavement |
Where are they located?
- All fourteen case studies are listed in the revision of Chapter 9: Case Studies.
Asset Value Calculation Templates
Bridge Asset Value Calculation Template
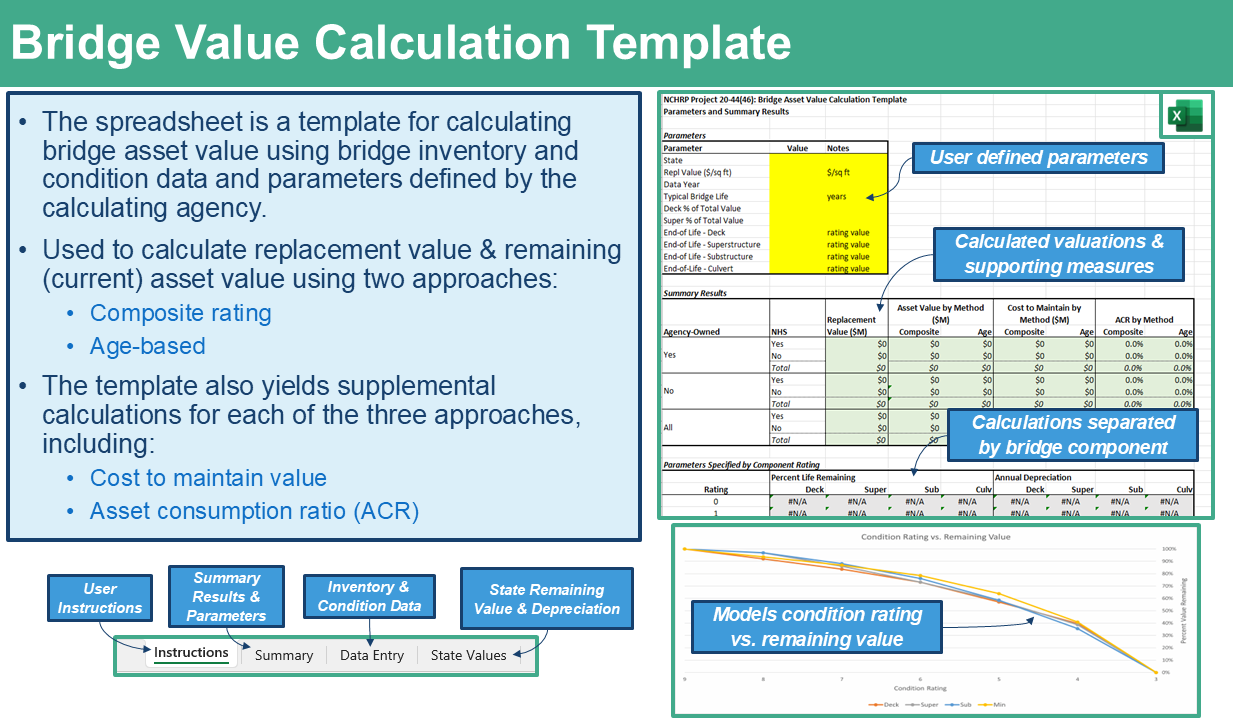
- Download the Bridge Value Calculation Template.
Ancillary Asset Value Calculation Template
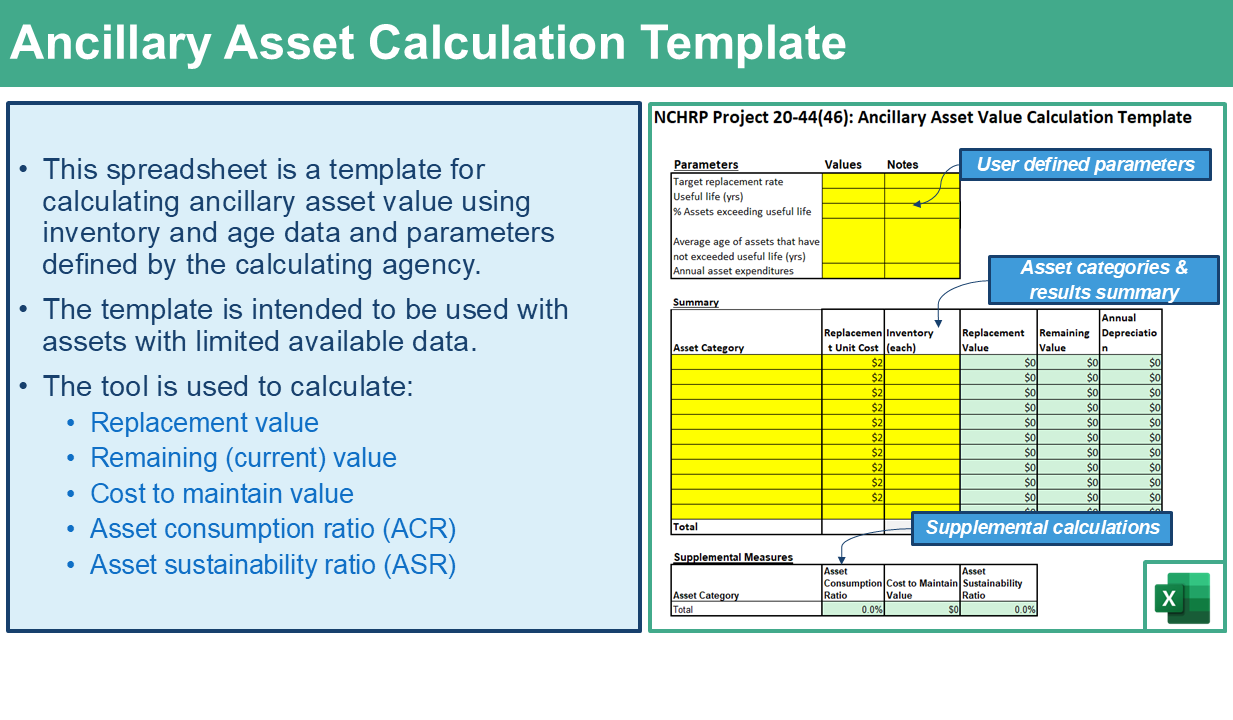
- Download the Ancillary Asset Calculation Template.
Note that Section 3.3 Establish the Asset Hierarchy discusses different considerations in establishing what asses classes to consider when performing the asset valuation calculation, and discusses different asset classes. The following additional resources discuss asset management strategies related to ancillary assets such as: signs, signals, guardrail, culverts, lighting, pavement markings, retaining walls, curb ramps, and noise walls.
- Allen, B.; Ram, P.; Koonce, J.; Raj, D.; Burns, S.; Zimmerman, K.; Smadi, O.; and Mugabe, K. Handbook for Including Ancillary Assets Transportation Asset Management Programs. FHWA, Report FHWA-HIF-19-068, 2019. Available at the following URL accessed September 17, 2025: https://www.fhwa.dot.gov/publications/research/infrastructure/19068/19068.pdf.
- FHWA. Transportation Asset Management Plans: Case Study 7 – Managing Assets Beyond Pavements and Bridges. FHWA, Report FHWA-HIF-20-092, 2020. Available at the following URL accessed September 17, 2025: https://www.fhwa.dot.gov/asset/pubs/hif20092.pdf.
- Spy Pond Partners, LLC; Applied Pavement Technology, Inc.; and WSP. AASHTO Transportation Asset Management Guide: A Focus on Implementation, Second Edition. AASHTO, 2020.
- Sturgill, R.; Harper, C.; Tran, D.; and Smadi, S. Management Practices for Ancillary Transportation Assets: A Synthesis of Highway Practice. NAS, NCHRP Synthesis 647, 2025. Available at the following URL accessed September 17, 2025: https://nap.nationalacademies.org/catalog/29059/management-practices-for-ancillary-transportation-assets.
Audio Version of the Digital Asset Value Guide
To improve the accessibility and usefulness of the Asset Value Guide, an audio version of the site was added. This audio version of the guidance covers the nine chapters of the site, as well as the two appendices.
These audio files were recorded using Voicemaker, a platform for converting text files to computer-generated narration.
Where are they located?
- These audio files were then embedded at the beginning of each chapter and section.
- The MP3 files can also be downloaded from the Guidebook Downloads page.
Glossary of Key Terms
Where is it located?
- The Glossary can be found in the “Support Materials” dropdown menu at the top of every page.
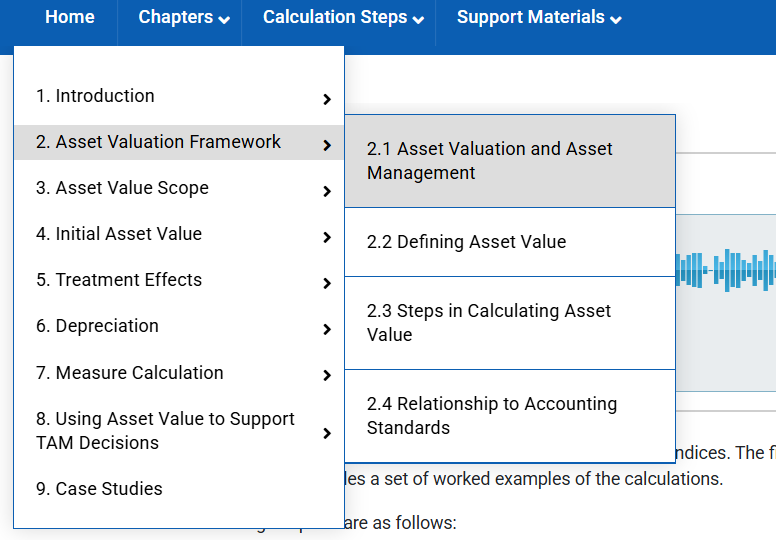
Improved Navigation Menus
Where are they located?
- Under the “Chapters” section in the banner at the top of every page.
New Color Theming
Where are they located?
- Each of the nine chapters has a new color theme applied automatically.
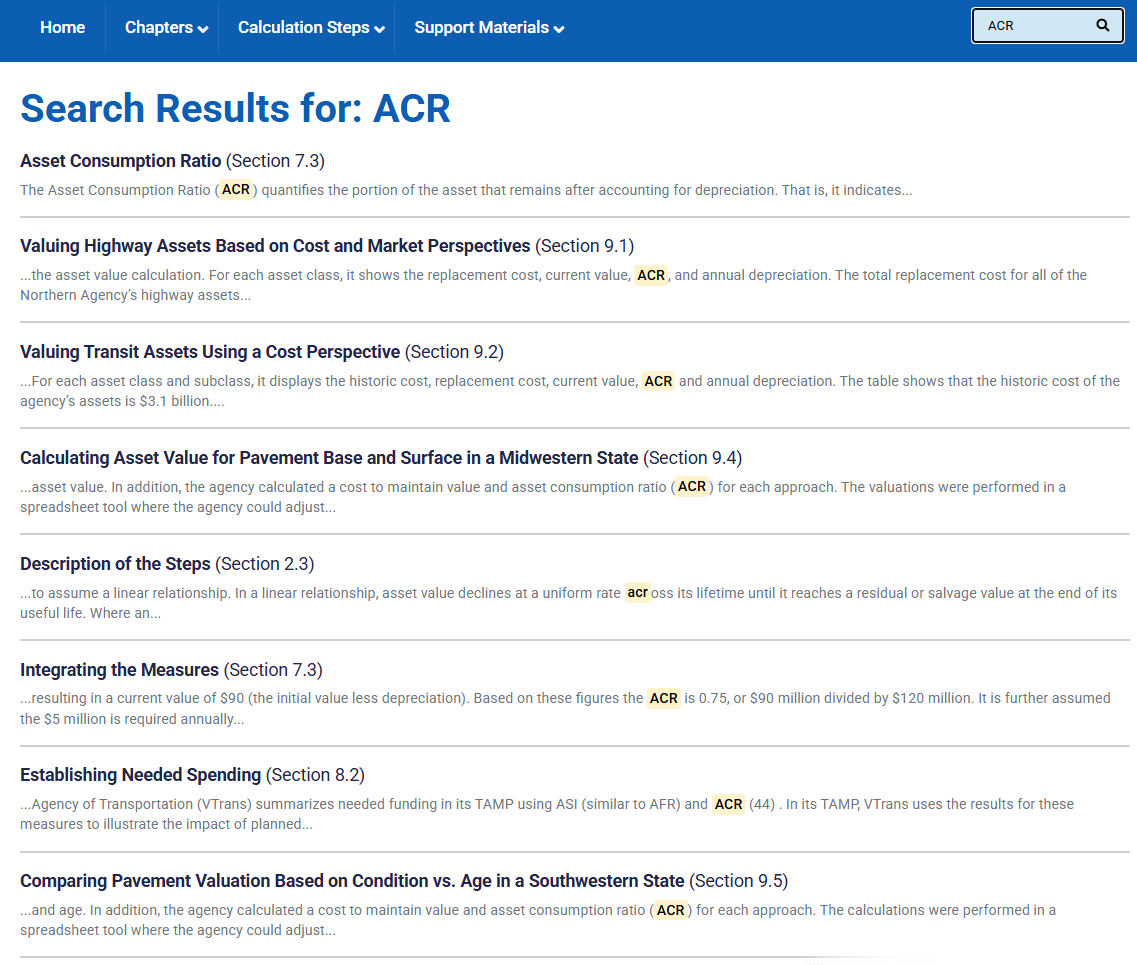
Revamped Search Functionality
Where are they located?
- The search feature can be accessed by typing a keyword or phrase in the search box located in the top right corner of each page.
NCHRP Project 20-44(46) Update Development
ACKNOWLEDGEMENT OF SPONSORSHIP
This work was sponsored by the American Association of State Highway and Transportation Officials, in cooperation with the Federal Highway Administration, and was conducted in the National Cooperative Highway Research Program (NCHRP), which is administered by the Transportation Research Board of the National Academies of Sciences, Engineering, and Medicine.
DISCLAIMER
This is an uncorrected draft as submitted by the research team.
This material is based upon work supported by the FHWA under Agreement No. 693JJ32350025. Any opinions, findings, and conclusions or recommendations expressed or implied in this document are those of the researchers who performed the research and are not necessarily those of the Transportation Research Board; the National Academies of Sciences, Engineering, and Medicine; the FHWA; or the program sponsors.
No warranty is made by the developers or their employer as to the accuracy, completeness, or reliability of this software and its associated equations and documentation. No responsibility is assumed by the developers for incorrect results or damages resulting from the use of this software.
COPYRIGHT
This material and the copyrights therein are owned by the National Academies of Sciences, Engineering, and Medicine.