As part of NCHRP Project 20-44(46), the research team used data from the Federal Highway Administration’s (FHWA) Bridge Investment Program (BIP) tool to develop deterioration curves by component for bridges. The data includes all US states and offers a straightforward and repeatable approach to establishing a relationship between bridge condition and remaining value.
Background
Ideally calculations of bridge asset value should incorporate depreciation, or consumption of the value of a bridge asset. One approach for calculating depreciation is to observe a bridge’s current condition and then use a deterioration model to estimate the time until the bridge reaches its useful life. This analysis is typically performed by bridge component. Bridges typically have three components: the deck, superstructure and substructure, while bridge-length culverts have a single component, the culvert.
While all State DOTs have bridge management systems that can be used to estimate useful lives of bridge and culvert components, in practice the calculation can be cumbersome to perform. This case study provides an approach for making the depreciation calculation using state-specific data compiled by FHWA.
Data
The FHWA BIP is a competitive discretionary funding program for improving bridge condition as well as safety and reliability. The BIP includes data on expected deterioration for each bridge in the National Bridge Inventory (NBI). This was compiled by performing model runs in FHWA’s National Bridge Investment Analysis System (NBIAS). Data obtained from NBIAS to support the BIP includes predicted component ratings for each bridge and bridge-length culvert in the NBI over a fifty year time horizon, broken up into five year periods.
Methodology
The team defined the following process for using the data in the BIP to develop bridge component depreciation curves for a given state:
- The first step is to compile BIP data for the selected state. The BIP data detail the predicted time to deteriorate (in number of 5-year periods) from current conditions to each component condition and from the minimum component condition given no work is performed on the bridge.
- The next step is to calculate the average decline in component condition per period for each component for each bridge.
- Next it is necessary to calculate the average annual condition drop for each component by initial rating value (0-9). This is accomplished by weighting each bridge by deck area to account for size, and dividing the first (five year) period drop by five to get an annual average.
- The next step is to use the average annual condition drop to determine the average time required to deteriorate to each rating value starting from new condition.
- Finally the depreciation curve is calculated by establishing the percent of value remaining at each rating value for each component. This is calculated by subtracting from 100% the ratio of time to deteriorate to the rating value to the time to reach the end of life (e.g. a rating of 3).
In conjunction with bridge inventory data and unit cost data, the resulting deterioration curves can be used to calculate a remaining asset value.
Results
Figure 9-12 below provides an example calculation of the percentage of asset value remaining for each of the components of a bridge, as well as for the minimum component rating. As shown in the figure, a component is assumed to have reached the end of its useful life if its rating is 3 or less. The minimum component condition rating approach uses the lowest component condition rating to define the effective age of the bridge. Note this is an example set of curves: the process can be repeated to obtain state-specific curves.

Lessons Learned
Key takeaways from the development of an approach for developing bridge deterioration curves in support of asset valuation are listed below:
- When attempting to define the relationship between bridge condition and remaining value, observed deterioration curves can be developed using FHWA BIP data in the absence of readily available defined deterioration curves.
- State DOTs typically have existing bridge deterioration curves; however they may be embedded in management systems and difficult to extract, or a state may have many deterioration curves for families of bridges. The work described in the pilot offers a simplified approach to deriving deterioration curves for a state bridges by component, and thus a path toward calculating a depreciated current asset value.
- The approach should be adjusted to meet an agency’s needs and/or data.
- For example, a state may find that culverts behave similarly to substructures, but that there is not enough data for culverts to calculate the time to deteriorate to each rating value. In this case, it is acceptable to use a substitute curve, such as the one for substructures, to represent the relationship between culvert condition and remaining value.
ACKNOWLEDGEMENT OF SPONSORSHIP
This work was sponsored by the American Association of State Highway and Transportation Officials, in cooperation with the Federal Highway Administration, and was conducted in the National Cooperative Highway Research Program (NCHRP), which is administered by the Transportation Research Board of the National Academies of Sciences, Engineering, and Medicine.
DISCLAIMER
This is an uncorrected draft as submitted by the research team.
This material is based upon work supported by the FHWA under Agreement No. 693JJ32350025. Any opinions, findings, and conclusions or recommendations expressed or implied in this document are those of the researchers who performed the research and are not necessarily those of the Transportation Research Board; the National Academies of Sciences, Engineering, and Medicine; the FHWA; or the program sponsors.
No warranty is made by the developers or their employer as to the accuracy, completeness, or reliability of this software and its associated equations and documentation. No responsibility is assumed by the developers for incorrect results or damages resulting from the use of this software.
COPYRIGHT
This material and the copyrights therein are owned by the National Academies of Sciences, Engineering, and Medicine.
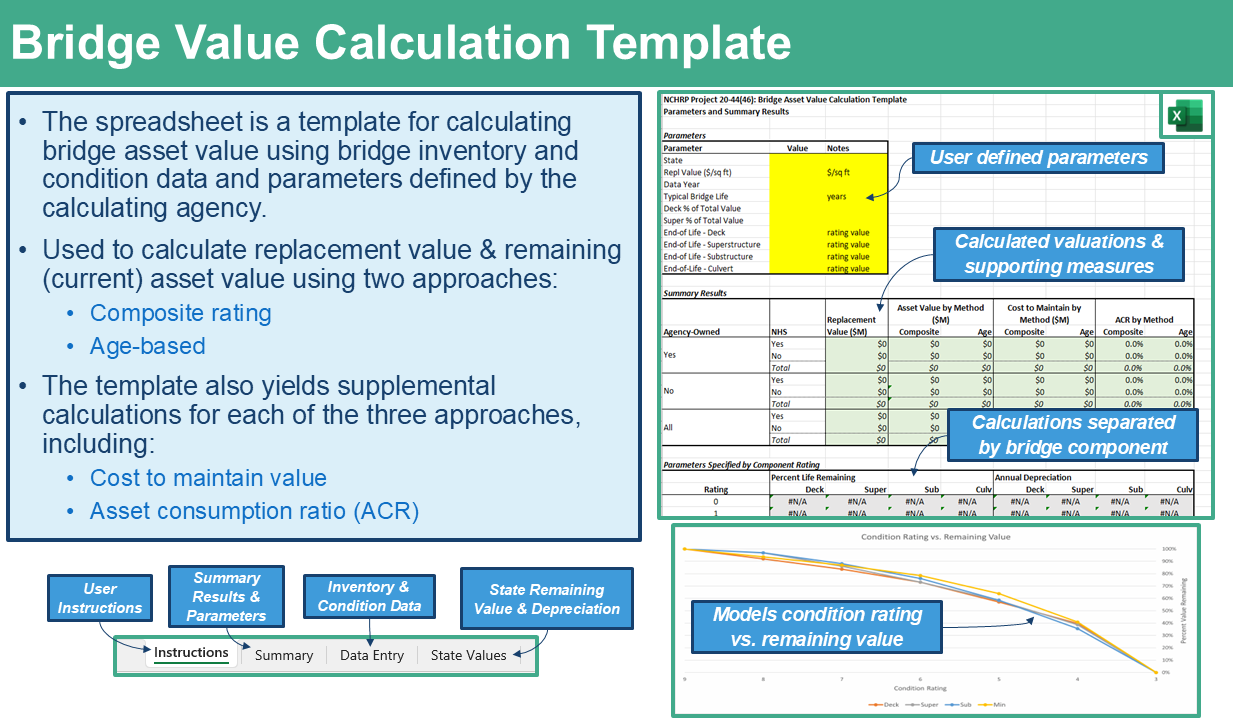
- Download the Bridge Value Calculation Template.