In this case study, a state department of transportation (DOT) located in the Northwest, labeled the “Northwestern DOT”, calculated asset value for its bridges using three depreciation approaches to measure their remaining (current) value. In comparing the results from the composite condition rating, minimum condition rating, and age-based approaches, the Northwestern DOT was able to gain a more complete understanding of its bridge inventory and identify the desired calculation approach for the agency’s needs.
Background
The Northwestern DOT’s primary driver for calculating and reporting asset value is to comply with the Federal Highway Administration’s (FHWA) requirement that State DOTs include a calculation of the value of National Highway System (NHS) pavement and bridge assets in their transportation asset management plans (TAMPs), and that they calculate the cost of maintaining asset value (23 CFR § 515.7(d)(4)).
In past versions of its TAMP, the Northwestern DOT estimated asset value based on replacement cost alone, without accounting for the assets’ age or condition. As a result, depreciation was not reflected in the valuation. This method also did not provide a useful estimate for the cost required to maintain asset value, since preserving full replacement value was calculated at $0. To enhance the accuracy and relevance of its asset valuations, the Northwestern DOT explored three depreciation-based approaches aimed at determining both the remaining value of bridges, and the cost necessary to sustain that value.
Methodology
Data
The Northwestern DOT used age and condition data from the National Bridge Inventory (NBI) to calculate asset value. For the age-based approach, each bridge’s value was calculated as a whole, while the condition-based approaches split each bridge into their three major components (deck, superstructure, substructure).
Condition-Based Approaches
While the relationship between the age of a bridge and its percent value remaining is assumed to be linear, bridges typically exhibit a non-linear relationship between condition and percent value remaining. The Northwestern DOT used data from a “do-nothing” scenario in the FHWA Bridge Investment Program (BIP) tool to develop deterioration curves for bridges within their jurisdiction based on component condition. The agency developed deterioration curves for each bridge component, as well as a “minimum component” deterioration curve based on the minimum component rating of a bridge. The end of life was defined as a component rating of 3.
Composite Component Rating Approach
The first approach tested by the Northwestern DOT was the composite component rating approach, in which the agency calculated the percent remaining value for each bridge component using the modeled deterioration curves. Those percentages were combined in a weighted average-based on defined parameters (20% deck, 40% superstructure, and 40% substructure) to obtain a composite percent value remaining for the entire bridge.
Minimum Component Rating Approach
The second approach was the minimum component rating approach, which used the lowest component condition rating of a bridge to define the effective age of the bridge.
Figure 9-10 shows the relationship between condition ratings and remaining value for each bridge component as well as for the minimum component. Note that the results shown for culverts are the same as that for substructure, as the agency found that culverts behaved similarly to substructures, but that there was not enough data for culverts to calculate a deterioration curve.
Age-Based Approach
The Northwestern DOT also used the typical bridge useful life to calculate an age-based valuation for each bridge. This method assumed linear depreciation by year, where the end of life for a bridge was set at 80 years and bridge age was defined by identifying the more recent of year built or year reconstructed. Figure 9-11 shows the curve representing the relationship between age and percent of value remaining for a given bridge.


Results
Table 9-12 summarizes the calculation of asset value for the Northwestern DOT’s bridges. The table includes replacement value as well as the remaining asset value based on the three approaches for calculating depreciation: using a weighted average of all three major components condition ratings, using the condition data of each bridge’s most degraded component, and using bridge age irrespective of condition. While the detailed results are available by owner (State DOT, Other), the case study results summarize all NBI bridges in the state, organized by whether or not the bridge is located on the National Highway System (On NHS, Off NHS).
Table 9-12. Asset Value Results
| NHS | Repl. Values ($B) | Remaining Asset Value by Method ($B) | ACR by Method (%) | Cost to Maintain by Method ($M) | ||||||
|---|---|---|---|---|---|---|---|---|---|---|
| Comp. Rating | Min. Rating | Age | Comp. Rating | Min. Rating | Age | Comp. Rating | Min. Rating | Age | ||
| State DOT | ||||||||||
| On | 45.3 | 34.1 | 29.6 | 22.5 | 75.3 | 65.3 | 49.6 | 871 | 1,118 | 552 |
| Off | 8.0 | 6.2 | 5.6 | 3.4 | 78.3 | 69.7 | 43.1 | 152 | 194 | 94 |
| Total | 53.3 | 40.3 | 35.1 | 25.9 | 75.8 | 66.0 | 48.6 | 1,023 | 1,313 | 646 |
| Other Owner | ||||||||||
| On | 5.6 | 4.1 | 3.5 | 2.9 | 73.4 | 64.0 | 53.0 | 107 | 138 | 61 |
| Off | 14.6 | 11.3 | 10.2 | 7.2 | 77.2 | 69.5 | 49.3 | 280 | 362 | 172 |
| Total | 20.2 | 15.4 | 13.7 | 10.2 | 76.2 | 68.0 | 50.3 | 387 | 500 | 233 |
| All | ||||||||||
| On | 50.8 | 38.2 | 33.1 | 25.4 | 75.1 | 65.2 | 50.0 | 978 | 1,256 | 613 |
| Off | 22.6 | 17.5 | 15.7 | 10.7 | 77.6 | 69.6 | 47.1 | 433 | 556 | 265 |
| Total | 73.4 | 55.7 | 48.9 | 36.1 | 75.9 | 66.5 | 49.1 | 1,410 | 1,812 | 878 |
Lessons Learned
Key takeaways from the Northwestern DOT’s comparison of age and condition-based depreciation approaches for bridge asset valuation are listed below:
- The approach chosen for calculating depreciation has a large impact on the end results. An agency should carefully consider which approach is most appropriate to meet its needs.
- The composite component condition approach typically yields a higher remaining value than the other approaches, as it considers the condition of each component of a bridge separately. This method accounts for the different characteristics of bridge components and allows the agency to adjust the weighting of each to match their standard practices.
- The minimum rating approach tends to yield lower valuations than the composite approach, as it uses the lowest component rating and assumes deterioration rates similar to that of the deck, typically the shortest-lived component. This approach also leads to a higher cost to maintain value compared to the composite approach, due to shorter useful life calculated in the model.
- Transportation agencies may select this approach to be conservative when calculating the value of their assets. Some bridge components are easier to repair or replace than others. For example, a bridge deck can be repaired or replaced relatively inexpensively, while a bridge substructure cannot be easily replaced without doing a full bridge construction.
- The age-based approach yields the lowest asset value, as it does not account for work performed on bridges to extend their life. A bridge that is beyond its useful life in age but has been well maintained and remains in good condition would have zero value remaining based purely on age.
- It is also essential that the parameters used in the calculations are consistent with the DOT’s real-world practices to get the most out of their calculation results.
- For example, the components in the composite approach should be weighted based on state-specific data and/or engineering judgement. Likewise, the definition of end of life should be aligned with current bridge management practices.
ACKNOWLEDGEMENT OF SPONSORSHIP
This work was sponsored by the American Association of State Highway and Transportation Officials, in cooperation with the Federal Highway Administration, and was conducted in the National Cooperative Highway Research Program (NCHRP), which is administered by the Transportation Research Board of the National Academies of Sciences, Engineering, and Medicine.
DISCLAIMER
This is an uncorrected draft as submitted by the research team.
This material is based upon work supported by the FHWA under Agreement No. 693JJ32350025. Any opinions, findings, and conclusions or recommendations expressed or implied in this document are those of the researchers who performed the research and are not necessarily those of the Transportation Research Board; the National Academies of Sciences, Engineering, and Medicine; the FHWA; or the program sponsors.
No warranty is made by the developers or their employer as to the accuracy, completeness, or reliability of this software and its associated equations and documentation. No responsibility is assumed by the developers for incorrect results or damages resulting from the use of this software.
COPYRIGHT
This material and the copyrights therein are owned by the National Academies of Sciences, Engineering, and Medicine.
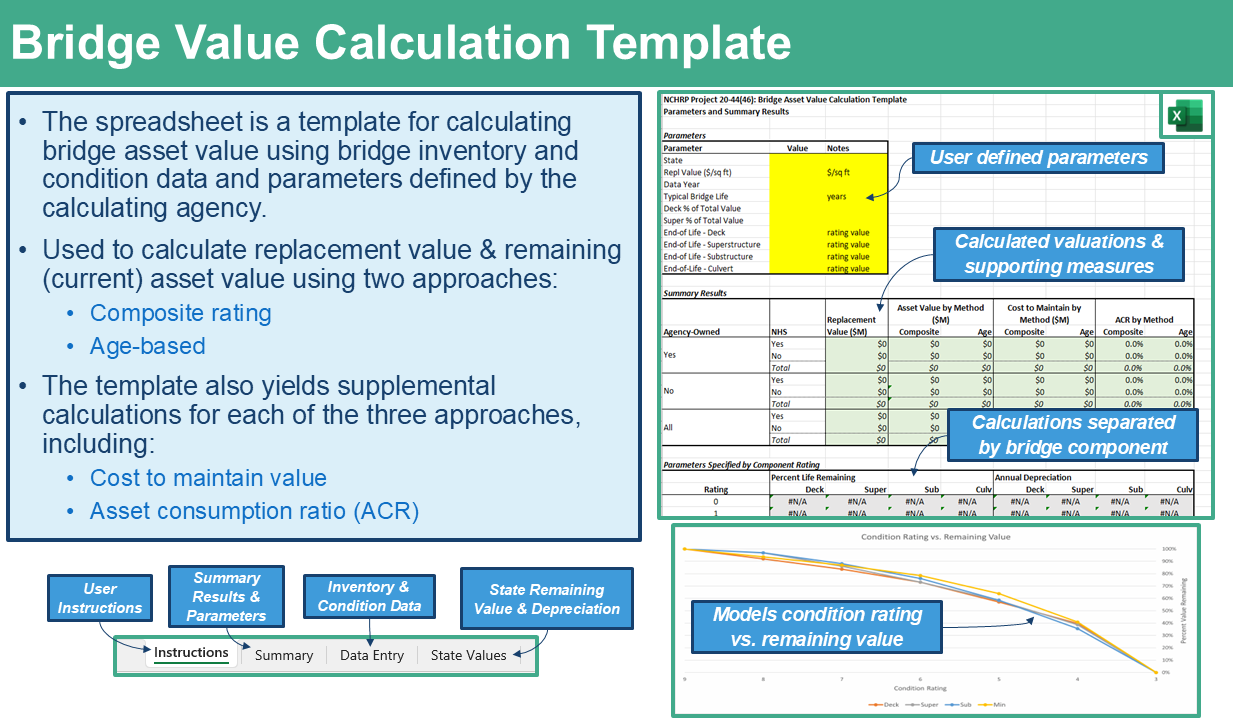
- Download the Bridge Value Calculation Template.