In this case study, a state department of transportation in the West, labeled the “Western DOT”, developed a tiered approach for calculating asset value for assets with varying levels of data availability. The agency, which includes numerous asset types beyond pavement and bridge in its asset valuation program, adjusted the calculation approach depending on the available data, allowing for a clearly defined and repeatable process.
Background
The Western DOT has two primary drivers for calculating and reporting asset value:. The first is to comply with the Federal Highway Administration’s (FHWA) requirement that State DOTs include a calculation of the value of National Highway System (NHS) pavement and bridge assets in their transportation asset management plans (TAMPs), and that they calculate the cost of maintaining asset value (23 CFR § 515.7(d)(4)). The second is to communicate asset value to the state legislature using an asset register (also included in the TAMP) containing an inventory and valuation for 14 asset types, ranging from bridge and pavement to lighting and signs.
In the Western DOT’s previous asset registers, asset value was typically calculated using a replacement cost approach that did not consider age or condition of the assets, and thus did not reflect depreciation of the assets. In addition, the calculation approach was not defined nor documented across the asset types, making it difficult to reproduce the results. The Western DOT decided to improve its asset valuation approach by developing and implementing a consistent methodology that meets the agency’s needs and reflects best practices.
Methodology
Data
Ideally, the Western DOT could calculate both a replacement value and a depreciated current value for all assets. However, based on available data, it was difficult to generate meaningful depreciated values for some assets. In recognition of the challenges presented due to differences in available data, observed deterioration behavior of the asset, and management approaches, the agency defined three different approaches that can be followed to calculate asset value, depending on the available data. At minimum, the proposed approaches allow for a consistent and repeatable calculation of replacement value. If sufficient data are available, a depreciated current value may also be calculated.
Comprehensive Data Approach
The comprehensive approach was the most advanced approach, but required sufficient data to calculate a condition or age-based depreciation to estimate current value. The Western DOT used this approach for assets with the most mature management process and the most available data. The necessary data to use the comprehensive approach include:
- Complete asset inventory (or random, representative sample of the data)
- Unit replacement cost
- Residual value (the value of an asset when it is fully depreciated)
And
- Age-based depreciation
- Useful life (the age at which an asset is fully depreciated)
- % of assets exceeding useful life
- Average age of assets that have not exceeded the useful life
Or
- Condition-based depreciation
- Condition scale (the condition at which an asset is fully depreciated)
- % of assets in each condition state
- % life remaining at each condition state
Moderate Data Approach
For assets with some inventory data but no age or condition data, it was not feasible to calculate a depreciated current value. Instead, the Western DOT used a simplified approach to calculate replacement value. Assets with moderate data used available inventory and unit cost data to calculate replacement value. If complete inventory data were not available, a random and representative sample could be used instead.
Minimal Data Approach
For assets with minimal data, it was not feasible to calculate a depreciated current value and was a challenge to calculate replacement value. When inventory data were not available, the Western DOT performed an analysis of available construction cost data and calculated an estimate of replacement value based on the extent of the road network, measured in centerline miles. This was a general approach that could be modified depending on the particular asset. The agency considered environmental characteristics and roadway types when choosing the scope of the road network to evaluate.
Results
After defining the calculation approaches, the Western DOT assigned and implemented an approach to each asset type depending on available data. Table 9-11 details the calculation of asset value for the Western DOT’s assets, organized by calculation approach. The table shows replacement value for all assets and remaining asset value where available.
Table 9-11. Asset Value Results
| Calculation Approach | Depreciation Approach | Asset | Replacement Value ($M) | Remaining Value ($M) |
|---|---|---|---|---|
| Comprehensive Data Approach | - Condition-based - Non-linear | Bridge | 14,560 | 9,695 |
| - Condition-based - Linear | Pavement | 27,655 | 24,378 | |
| Signals | 482 | 321 | ||
| Culverts/ Storm Drains | 2,503 | 7,217 | ||
| Barrier | 878 | 658 | ||
| - Age-based - Linear | Striping | 149 | 56 | |
| ITS | 829 | 603 | ||
| Signs | 975 | 435 | ||
| Lighting | 194 | 74 | ||
| Moderate Data Approach | None | Rumble Strip | 21 | Not calculated |
| Cattle Guard | 85 | |||
| Fence | 289 | |||
| Concrete Flatwork | 167 | |||
| Walls | 9,012 |
Lessons Learned
Lessons learned from the Western DOT’s experience in developing asset valuation approaches for varying levels of asset data include:
- Calculating asset value can be challenging for assets with less mature management processes and less available data
- Using simplified calculation approaches for different levels of data availability allows an agency to calculate asset value for a range of assets.
- The first step towards asset valuation is to evaluate the availability of data and select an approach: comprehensive data, moderate data, or minimal data. The minimal data approach may be the best approach for many assets that are trying to build maturity in asset valuation. This approach can help define a repeatable process for calculating replacement value on an annual basis. The approach can be updated for each asset if necessary as more data are made available.
- Having a defined, repeatable asset valuation process is important for building asset valuation maturity
- Repeating the calculation on a regular basis allows an agency to measure and compare progress over time. Without a consistent calculation approach, comparisons are less meaningful
- While some assets may have data gaps, developing simple valuation approaches is possible. The initial effort of developing the valuation approach can help identify data gaps and make progress towards closing those gaps and improving the valuation approach.
ACKNOWLEDGEMENT OF SPONSORSHIP
This work was sponsored by the American Association of State Highway and Transportation Officials, in cooperation with the Federal Highway Administration, and was conducted in the National Cooperative Highway Research Program (NCHRP), which is administered by the Transportation Research Board of the National Academies of Sciences, Engineering, and Medicine.
DISCLAIMER
This is an uncorrected draft as submitted by the research team.
This material is based upon work supported by the FHWA under Agreement No. 693JJ32350025. Any opinions, findings, and conclusions or recommendations expressed or implied in this document are those of the researchers who performed the research and are not necessarily those of the Transportation Research Board; the National Academies of Sciences, Engineering, and Medicine; the FHWA; or the program sponsors.
No warranty is made by the developers or their employer as to the accuracy, completeness, or reliability of this software and its associated equations and documentation. No responsibility is assumed by the developers for incorrect results or damages resulting from the use of this software.
COPYRIGHT
This material and the copyrights therein are owned by the National Academies of Sciences, Engineering, and Medicine.
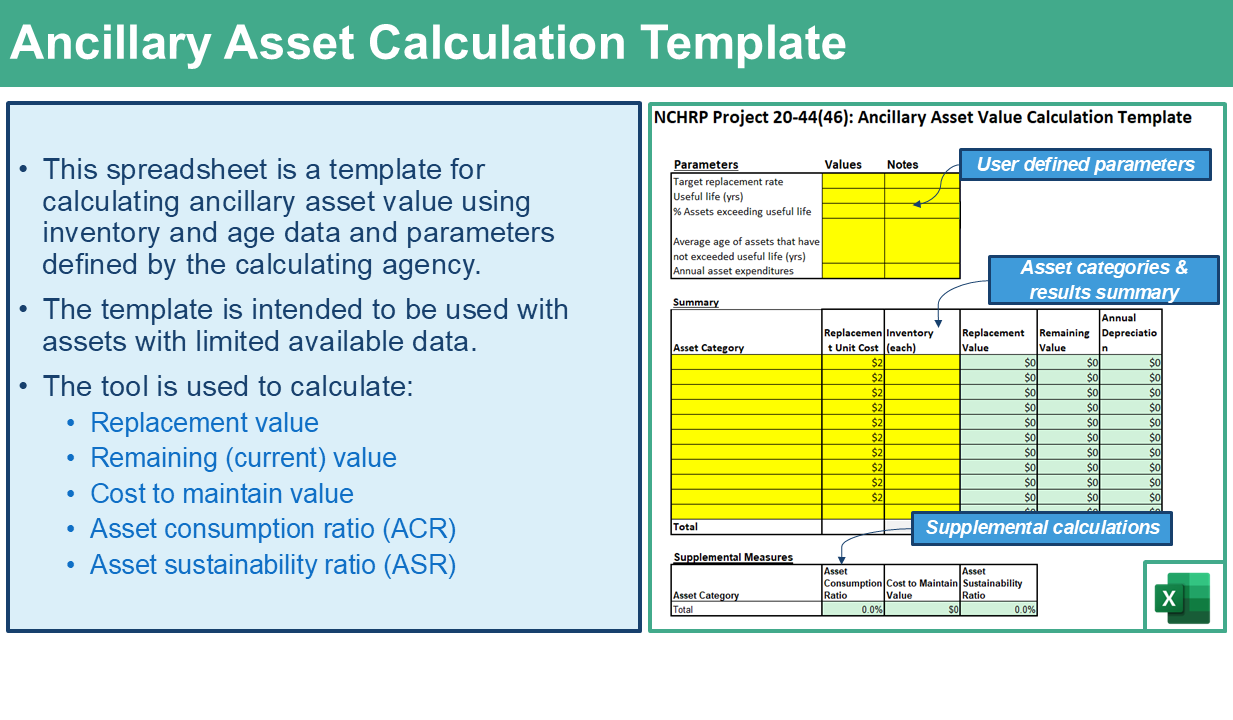
- Download the Ancillary Asset Calculation Template.